
What is fundamental analysis?
A fundamental analysis is an analytical method which focuses on the intrinsic or real value of a share. According to the fundamental analysis theory a stock price will in the long term always move towards this value. A fundamental analysis considers revenues, earnings, profit margins and other factual data to predict the price course of your shares. How can you use a fundamental analysis to achieve better investment results?
What is fundamental analysis?
Fundamental analysis is a technique which you can use to determine whether you should buy a certain share. The objective of fundamental analysis is to determine whether a stock is undervalued or overvalued. The stock’s intrinsic or real market fair value is determined by looking at the prospects of the company. In contrast, technical analysis ignores the financial statements but is based on the current share price movements.
How can you apply fundamental analysis?
A fundamental analysis can be performed on various levels. Before buying a share, it is recommended to take a look at the different levels.
The broadest level to focus on is the economy as a whole. When you apply this level of analysis, you look at the economy of an entire country. The economic situation of a country has a major influence on the price fluctuation of a share. When the economy of a country does well, the demand for different products and services will increase. Businesses will subsequently be able to increase their profitability which will cause stock prices to rise.
Another focus level is the specific sector or niche. At this level you focus on the sector in which the company is active. Some sectors have better prospects and are more profitable than other sectors. Retail shops for example are continuously losing customers to online shops. These types of developments can have a positive or negative effect on the share prices of the companies which are active within this sector.
When you apply fundamental analysis, you will focus your efforts on an individual share most of the time. In the rest of the article we will explain how you can determine whether a company is doing well from a fundamental point of view.
Tip: A fundamental analysis is mainly used for shares. A fundamental analysis can nevertheless also be used for other securities like bonds and derivatives.
The basis: does a company have a competitive advantage?
The basis of fundamental analysis is to determine whether a company has a competitive advantage. Is a company performing better than its competitor? To determine whether this is the case, you will have to analyse the activities of the company and compare their results with those of companies that are active in the same sector.
Research whether the company has a unique advantage compared to other companies. If the company has a strong competitive advantage, there is a high probability for a positive development of the share price in the future.
Qualitative vs quantitative analysis
A fundamental analysis can be divided into a qualitative and a quantitative analysis. A quantitative analysis purely focuses on the numbers. When you apply this type of analyses you can for example research the profit and turnover numbers.
A qualitative analysis researches focuses at less tangible things. Think about the quality of the management or the future plans of the company.
Examine the opinions of all stakeholders
When you perform a fundamental analysis, it is also wise to investigate the expectations of other parties. You can for example focus on the company’s expectations for future growth. Companies regularly publish their profits and their profit expectations.
Other professional investors
You can also consult the analyses of professional investors. Especially when this professional investor has a large group of loyal followers, their opinion can cause shares to move in a certain direction. Moreover, professional investors often have in-depth knowledge of certain stocks. There is always a chance they might have seen or discovered something you have overlooked during your analysis. Two pairs of eyes are better than one. Use their analyses to fine-tune your predictions. Watch out though… even the best make mistakes!
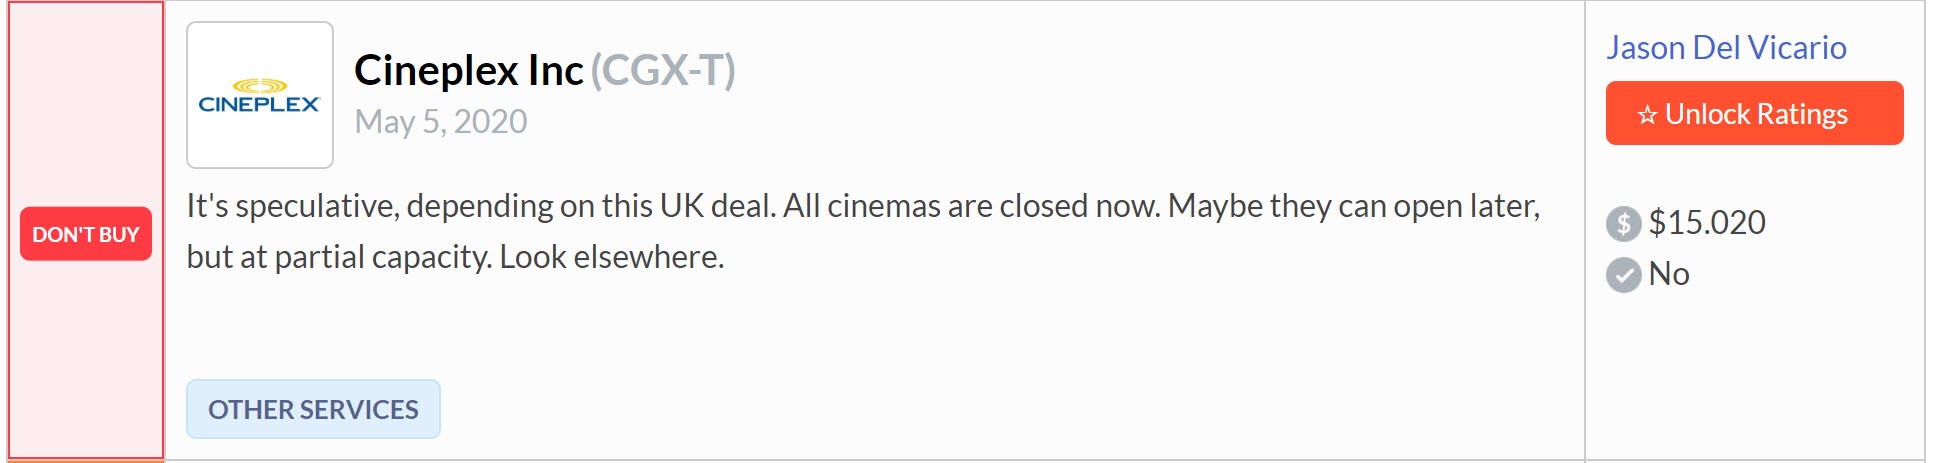
Experts are regularly publishing their reviews and opinions about shares. Source: stockchase.com
General sentiment
Finally, it might help to get an understanding of the general sentiment. To get an idea of the general sentiment, you can browse through news websites and forums. The general sentiment has a strong impact on the share price fluctuations. Panic among investors can cause a dramatic share price crash. When a share price crash occurs, it is important to determine whether it is because of the company performing poorly. When a company is still doing well and has good prospects, times of panic may be the ideal moment to buy new shares.
Various small news updates might cause fierce reactions in the world of stock trading. When the CEO of a company is for example out for a week due to illness, this might have a negative effect on the price of that share. It frequently occurs that a rumour (which appears to be fake news later on) has a strong impact on share prices. An example of a rumour that can strongly influence the price of a share is a rumour about a potential take-over.
Which reports are published by a company?
Companies which are publicly listed need to periodically share their financial data. Based on this financial data you can determine the health and stability of a company. You can use the balance sheet, the profit and loss statement and the cashflow statement.
The balance sheet
The balance sheet is a statement which reports the company’s assets and debts at a certain moment. On the left side you can consult the assets, the cash and the inventory of the company.
On the right side of the balance sheet you can find the liabilities and shareholders’ equity. The shareholders’ equity shows the amount of money which has been invested by the shareholders. You can also determine the size of the debts the company holds, and you can discover whether the company has put parts of the profit aside.
The balance sheet can provide you with interesting insights about the financial health of a company. You can for example determine whether the company has many debts. The balance sheet, however, does not show you the current profitability of the company.
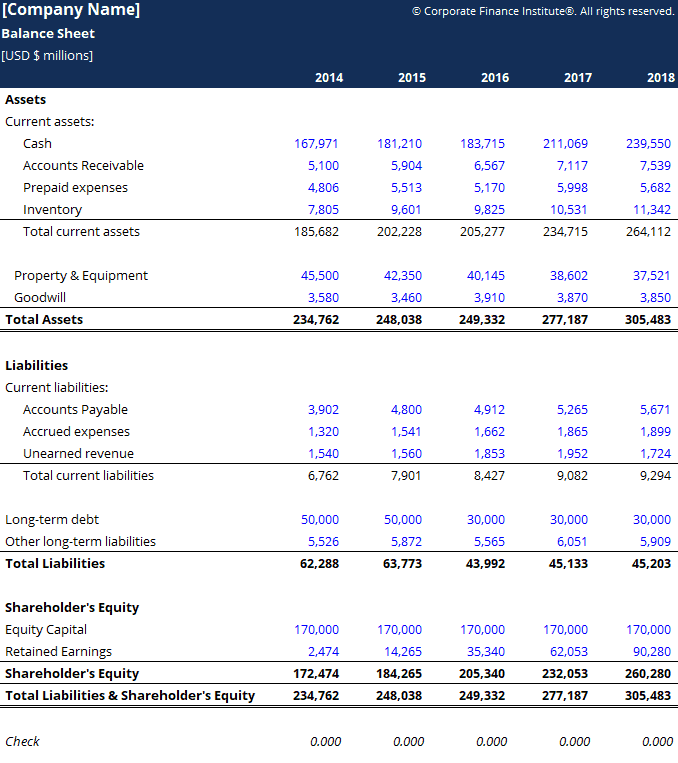
Example of a balance sheet
The profit and loss statement
The profit and loss statement is a financial statement which shows you the longer-term financials of the company. The financial figures are usually quarterly or yearly figures. This statement usually reports the following data:
- Net-turnover: all the revenues of the company over this time period.
- Gross profit:the revenues minus the costs which are causally related to the turnover.
- Operational result:the profit minus the general operating costs.
- Result of normal operations before interest payment: the amount which remains after deducting extraordinary income and expenses.
- Result of normal operations before tax payment: the profit of a company before taxes are paid.
- Result upon tax payment: the profit which remains after paying taxes.
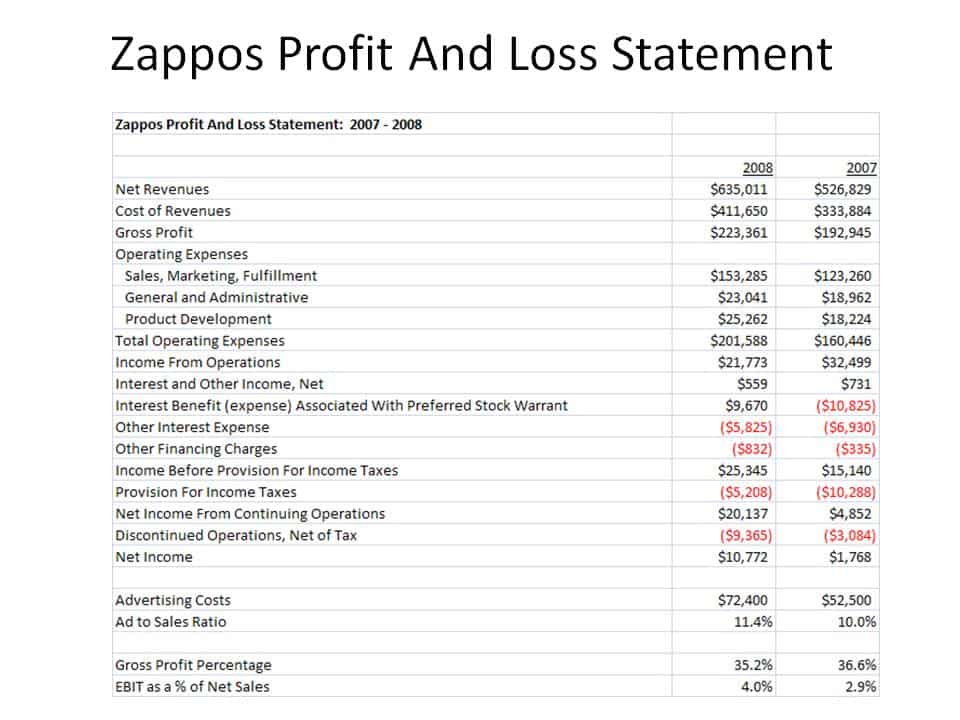
Example of a profit and loss statement
Cash flow statement
The cash flow statement indicates the liquidity of a company. Sometimes a company can be profitable but still have a lack of money. This mainly happens when the company has so-called paper profits which show in the financial records but which have not yet been received by the company. It is of crucial importance to investigate whether a company still has sufficient money to meet its obligations. A distinction is made between 3 sources of money:
- Money for investments (CFI): money which is used for investments.
- Money for financing (CFF): money which has been used or received after lending or borrowing money.
- Operational cash flow (OCF): money that stems directly from the company’s daily operational activities.
Many investors place great value on the cash flow statement of a company. Smart accountants can for example manipulate the profitability of a company by playing with the depreciation expenses. Manipulating the incoming cash flow is a lot trickier:
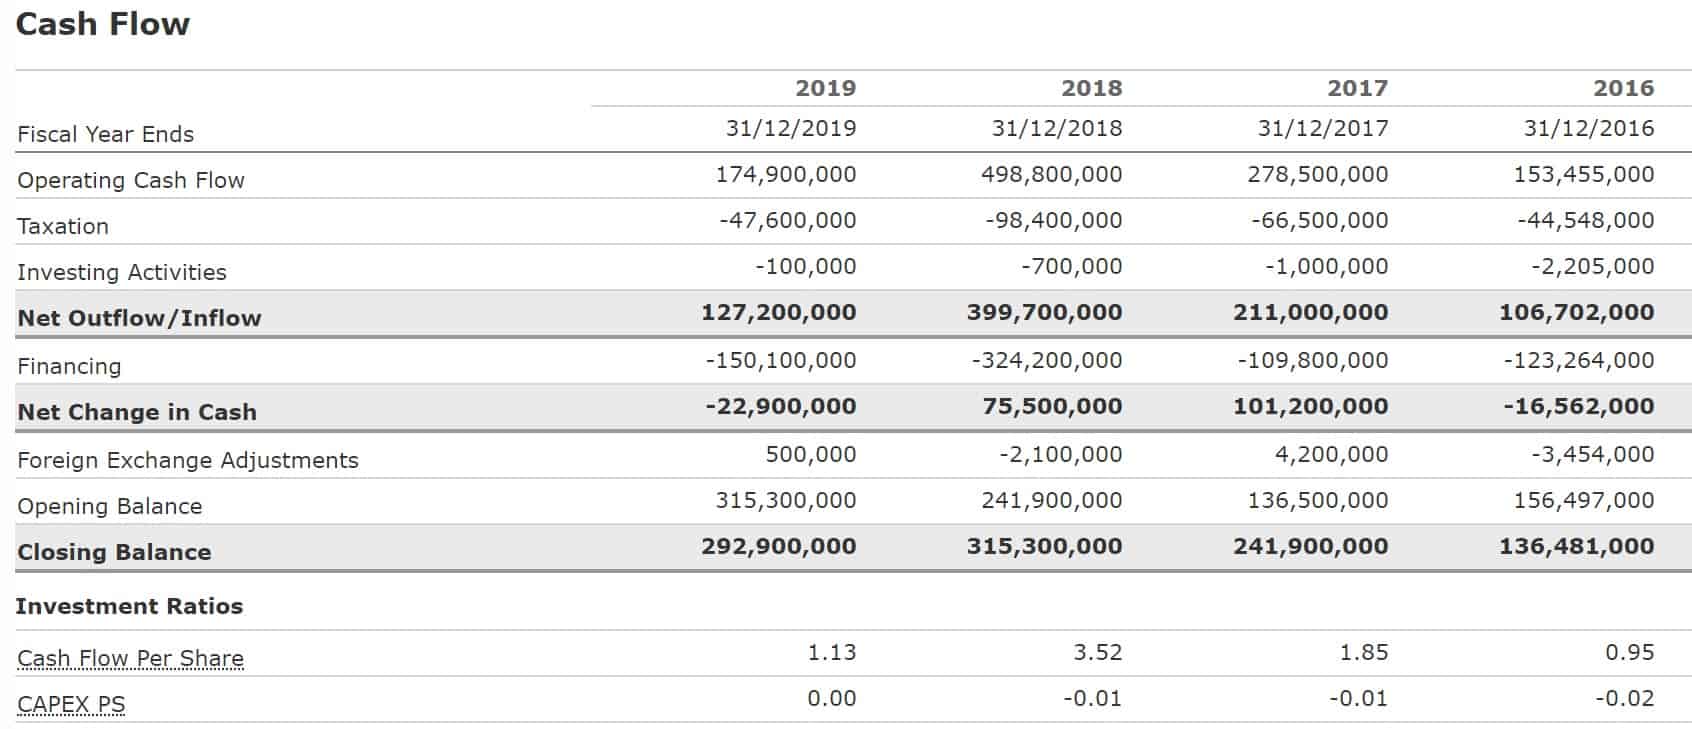
Example of a cash flow statement
What are important fundamental indicators?
The annual report plays an important role in fundamental analysis. Before you buy a share, it is therefore recommended consulting a company’s annual report. Based on the annual reported data, you can easily determine whether a company is financially healthy or not.
By examining the financial health of a company you can determine whether it is wise to buy the share right now. This part of the article will discuss the important fundamental indicators which can be used to take investment decisions.
Calculating the earnings per share is child’s play. To determine the earnings per share, we divide the net profit by the number of outstanding shares. You can use the earnings per share to determine whether there has been a positive trend. When the earnings per share have gradually increases over the past years this is a positive sign.
The price-earnings ratio
Another important indicator is the price-earnings ratio. This ratio indicates how many years are needed to earn back the current stock price. To calculate this ratio, you divide the profit per share by the number of outstanding shares. Low ratio numbers can be an indication that the share is undervalued. This could therefore be an interesting moment to buy your shares.
On the other hand, when the ratio result is on the high side, this could be a reason not to buy the share. These kinds of shares are often very speculative. Shares with a very high ratio between price and earnings are often start-ups.
In general, share portfolios with a low price-earnings ratio are performing better than portfolios with higher price-earnings ratios. An advantage of this indicator is that you can quickly determine whether a share is overvalued or undervalued. It is nevertheless important to also take other factors and indicators into account.
Some companies distribute part of their profit by paying out a dividend. More details can be found in our article what is a dividend. The dividend per share indicates how much dividend you will receive for your share. This can easily be calculated by dividing the total dividend by the number of outstanding shares. An increasing dividend per share can make it more attractive to invest in that stock.
The dividend per share is also known as the dividend yield or the dividend-price ratio. This is the percentage of the stock’s value which is paid through a dividend. When you use the dividend yield to calculate your dividend, it is easier to compare the result with other shares.
A company’s equity consists of the value of the shares and the outstanding reserves. If you divide this value by the total number of shares, you will get the equity per share or equity per stock. It is also referred to as the intrinsic value of a share. When the share price is lower that the equity per share, it might be interesting to buy the share.
More advanced fundamental indicators
When you perform a fundamental analysis, you can use various fundamental indicators. When you want to make a complete analysis you can also use these advanced fundamental indicators.
RORC or return on research capital
This is an interesting number when you are looking to trade in companies for which research is of paramount importance. To calculate this number, you need to divide the current gross turnover by the Research & Development expenses. The result will allow you to determine whether the invested money has resulted in additional turnover.
Do take into account that there is not always a strong relationship between research and profits. The additional profits produced by research may only be achieved years after the completion of the research.
What is Yield on cost (YOC)?
The Yield on Cost is the dividend yield on the initial investment. The yield on cost is not very useful for making predictions regarding the share price. After all, depending on when you have made your investments, the share price is lower or higher. Share price fluctuations are not taken into account within this indicator. Therefore, the YOC mainly proves to be useful for calculating your return on investment.
Volatility
When considering investments, you can also look at the volatility of a stock. When a share price is very volatile, it is often a bad omen… a proof of uncertainty. Your analysis should research the origin of this uncertainty. When you are looking for stable investments, volatile shares can better be ignored. Volatile shares nevertheless do offer opportunities. When you buy a volatile stock at the right moment, you can achieve a huge return on investment.
Using the order book
Brokers often offer you the possibility to use the order book. The order book tells you how many investors are planning to buy or sell a certain stock. These numbers are interesting in the short term: the orders help you to predict whether a share price will rise or fall in the near future. The order book can also be used as part of your long-term strategy because you can use it to find an attractive moment to start your investment in the share. There are nevertheless better ways and methods to make proper long-term predictions than to use the order book.
Investments by the management
Another good approach is to keep a close eye on the management of a company. When the management is buying additional shares, this can often be a positive sign. After all, the management of a company are the first ones to know whether their business is doing well or not. They have the first hand inside information and their behaviour often reflects the health of the company.
Do some research though because investments of the management do not always automatically reflect the well-being of a company. Maybe one of the directors sold some shares because he would like to buy a new house and not because he is losing confidence in the company. Therefore, always take your decisions based on multiple fundamental analysis data.
Fundamental analysis applied to Forex
When talking about Forex trading the macro-economic numbers play an important role. Because this is such a huge market, one little party can barely influence the currency price. When you focus on Forex trading it is therefore important to keep an eye on the economic and political situation of the country or region where the currency is used. The following indicators can help you to make the right analysis:
- The current interest rate
- The Gross National Product
- The consumer price index (CPI), the inflation and other expense indicators
- The unemployment rates within the region
- The consumer confidence
- The trade balance of the country
- The governmental fiscal and monetary policy
What is the intrinsic value?
Fundamental analysis is used to determine the intrinsic value of a share. The interplay between supply and demand determines the price of a share. The price of a share is not always a perfect reflection and representation of the true performance and health of the company behind the share. Even when a company does not have a proper plan or interesting prospects, hypes can still result in huge stock price increases. Similarly, some tend to sell their stocks en masse during a crisis, while the company is still performing well.
You can use fundamental analysis to determine the real value of a company. True believers of fundamental analysis believe the stock price will gradually move towards this real value in the long term.
Fundamental analysis, nevertheless, is not an exact science. Experts often disagree and there is not one true method to evaluate the intrinsic value of a share. Two investors can have two entirely different opinions whereby one investor concludes to sell his shares while another one plans to buy even more shares. It is therefore important to remember that fundamental analysis is only a method to approach the intrinsic value of a stock as closely as possible. The true value of a share will always remain fairly subjective.
What are the advantages of a fundamental analysis?
Fundamental analysis is particularly useful for discovering medium to long-term investment opportunities. By analysing the results, you can predict whether the prospects for your stock or currency are positive. With this information, you can decide whether it is wise to buy or sell the researched asset.
By analysing the numbers behind a company, you make rational choices as an investor. People are feeling machines often led by emotions. A fundamental analysis can help you to avoid taking important investment based on your feelings.
By applying your fundamental analysis in a proper and smart way, it is easier to determine when a share is traded too cheap or too expensive. This way, you know whether it is smart to invest when a market correction occurs.
What are the disadvantages of a fundamental analysis?
People also bump into various disadvantages when making their fundamental analysis. Making a proper and detailed fundamental analysis is a time-consuming task: you need to combine the information and data of various sources to achieve a clear and valuable overview. Therefore, creating a fundamental analysis can be a complex matter which is often not really suitable for traders who like to move fast.
The results produced by a fundamental analysis are often long-term results. Therefore, fundamental analysis has little to no value for day traders. If you prefer trading in the short term, a technical analysis might be more valuable and useful.
Making a fundamental analysis is often an uphill battle and hard work for investment newbies. It can be a struggle to properly compare the different sources. Most beginners therefore opt for technical analysis.
Moreover, a fundamental analysis means taking into account unexpected situations. A company can for example be on the right track but still report bad results. This for example happened during the financial crisis in 2008 and during the corona crisis in 2020.
Although a combination of both fundamental and technical analysis has proven to be the most successful, combining both in practice is a hell of a job which requires in-depth knowledge and expertise. Properly making both a fundamental and technical analysis is only possible when you are a full-time trader. Practice makes perfect and never fail to try… by doing so you will discover which method works best for you!
Criticism on fundamental analysis
Not everyone is a believer in the merit of fundamental analysis. Technical analysis advocates and aficionados believe all required knowledge is captured in the current share price. According to them, it is useless to try to determine the intrinsic value of a share. It is better to recognize patterns in the graph and to act upon these patterns.
Efficient market hypothesis advocates believe it is impossible to beat the market in general. According to this theory, shares are always sold at the most efficient price. The market immediately takes advantage of opportunities causing them to disappear in the blink of an eye. In all honesty, I am not a believer in this vision. The average investor is not that rational and when you apply the right techniques, you can take advantage of the stock market and get good a good return on your investment.
Auteur

Over Alex Mostert
When I was 16, I secretly bought my first stock. Since that ‘proud moment’ I have been managing trading.info for over 10 years. It is my goal to educate people about financial freedom. After my studies business administration and psychology, I decided to put all my time in developing this website. Since I love to travel, I work from all over the world. Click here to read more about trading.info! Don’t hesitate to leave a comment under this article.