
Forex investing (2024): how can you start trading Forex?
Trading in foreign currencies is also known as Forex trading. Do you also want to start trading Forex? Then you are in the right place on this page! Here you will learn everything you need to know about investing in Forex.
What is Forex?
Forex stands for Foreign Exchange Market. In Forex trading, we are talking about anyone who exchanges one currency for another. People who do not actively invest also participate in Forex, for example when they buy an ice cream in another currency on vacation.
The Forex market is the largest financial market in the world with a daily trading volume of $6.6 trillion: that's a number with 18 zeros! But where can you start trading the Forex market yourself?
What are the best brokers to invest in Forex?
In the overview below you can see my favorite Forex brokers:
| Brokers | Benefits | Register |
|---|---|---|
| Buy without commissions. Your capital is at risk. Other fees may apply. | ||
 | Speculate with CFD's on increasing & decreasing prices of ! 82% of retail CFD accounts lose money. | |
 | Benefit from low fees, an innovative platform & high security! | |
 | Speculate on price increases and decreases of with a free demo! |
How does investing in Forex work?
When you invest in Forex, you speculate on price movements between two currency pairs. For example, you can speculate on a rising euro exchange rate in relation to the dollar. When the price of the euro then rises, you make a profit. Of course, the opposite can also happen: just like with all other forms of investment, you can lose money.
Currency pair
When trading Forex, you always trade in a currency pair, for example EUR/USD. With EUR/USD, you trade in the price development of the euro against the dollar.
The value of a currency is always indicated in relation to another currency.
Long/short
You can then open a long or short position in Forex trading:
- Long: with a long position, you speculate on a rising price.
- Short: with a short position, you speculate on a falling price.
With EUR/USD, you speculate with a long position on a rising euro exchange rate against the dollar and with a short position on a falling euro exchange rate against the dollar.
Leverage
Currency pairs are often relatively stable: you will not see the euro rise or fall several percent in one day. By using leverage, you can further increase your investment results.
With Forex brokers, you can use leverage of 1:30 within Europe:
- With a long position, a price increase of 1% results in a profit of 30%
- With a short position, a price increase of 1% results in a loss of 30%
Opening your first Forex trade
After you have opened an account with a Forex broker, you can open your first investment position. Conduct enough research first: only trade in Forex when you fully understand what you are doing.
Select the currency pair you want to trade within the broker's software. In this example, we are opening a trade on the EUR/USD currency pair.
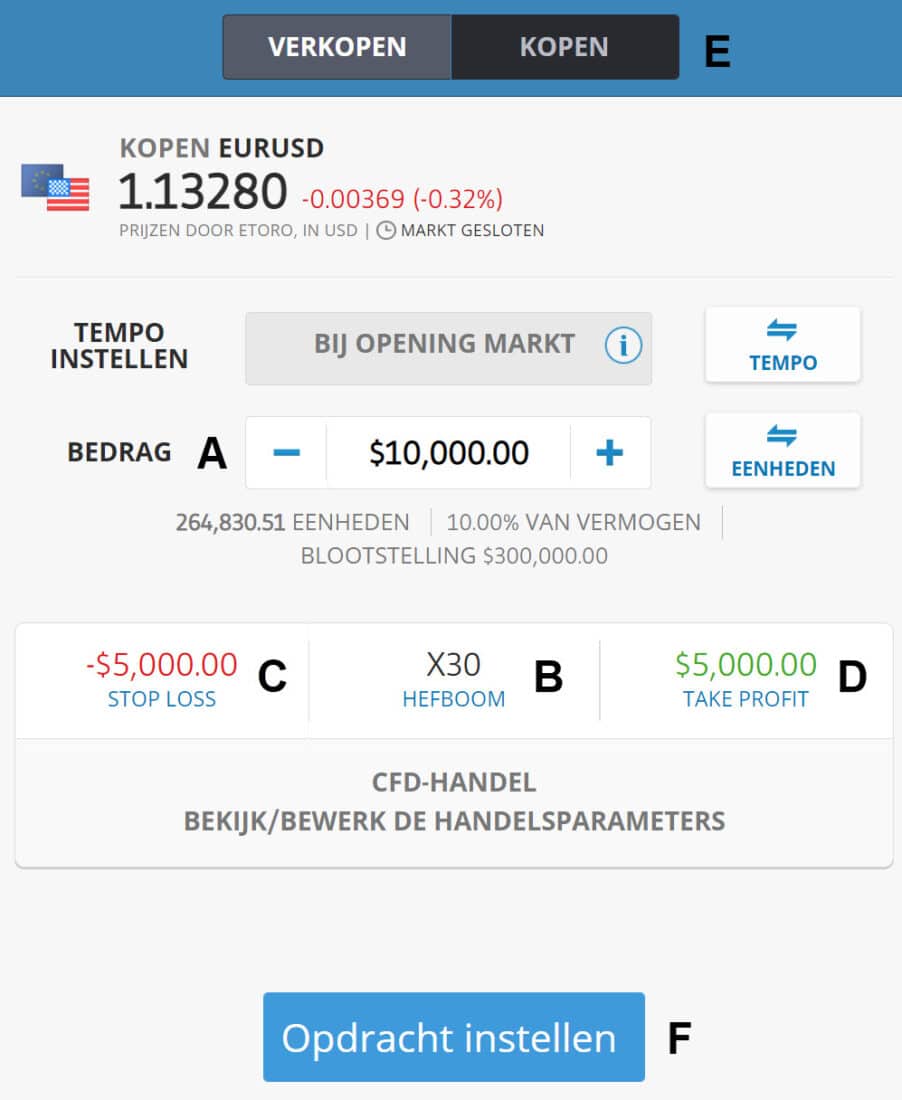
In the order screen, enter the following information:
- A: Enter the amount you want to invest in the currency pair
- B: Select the leverage you want to apply to your investment
- C: With a stop loss, you can automatically close the position at a certain loss
- D: With a take profit, you can automatically close the position at a certain profit
- E: Choose between a long or short position
- F: Press Order to open the investment
Once you have opened your Forex trade, you can change or close it at any time. Your profit or loss on your Forex trade is only final when you close the position.
What securities can you trade in Forex?
- Direct: With many brokers, you can directly exchange currencies with each other.
- CFD: With a CFD, you can speculate on fluctuations in currency prices.
- Option: With an option, you buy the right to buy a currency at a certain price.
- Turbo's: Turbos are similar to options.
What currencies can you trade in?
Currency pairs are divided into different categories:
- Major pairs: These are the most traded currency pairs, namely EUR/USD, USD/JPY, GBP/USD, AUD/USD, USD/CHF, NZD/USD, and USD/CAD.
- Minor pairs: These are other combinations of the currencies in the major pairs.
- Exotic pairs: All other currency pairs such as the Turkish lira.
How is the exchange rate determined?
Many people who trade Forex online speculate: they try to estimate the short-term price development. To achieve good results with Forex trading, it is important to understand how the exchange rate is determined.
The exchange rate is determined by the interplay of supply and demand, just like with stocks, there are different amounts of buyers and sellers of a currency at any given time.
- When demand for the euro increases, the exchange rate goes up.
- When demand for the euro decreases, the exchange rate goes down.
For example, the euro may appreciate in value relative to the dollar, but at the same time depreciate in value relative to the Japanese yen.
There are many factors that can influence the exchange rate, such as:
- Interest rates: when interest rates are higher, demand for the currency increases
- Economy: in a healthy economy, the currency's exchange rate will go up
- Taxes: lower taxes have a positive influence on a currency's exchange rate
You can basically remember that anything that makes a currency more attractive can lead to a higher exchange rate.
Base & quote: reading exchange rates
The first part of a currency is called the base and the second part is called the quote. In the case of EUR/USD, the euro is the base currency and the dollar is the quote currency. EUR/USD therefore indicates what the value of one euro is in dollars.
When the EUR/USD exchange rate is 1.2, you can buy one dollar 20 for one euro. When the exchange rate then moves to 1.21, you receive more dollars for one euro. The euro has then become more valuable in relation to the dollar.
Currency exchange rates are very precise; they are often shown to four or five decimal places. Results are then expressed in pips:
- For almost all currency pairs, one pip is the fourth decimal place, so 1.1234
- For currency pairs with the Japanese yen, one pip is the second decimal place, so 100.12
When the EUR/USD exchange rate increases by 10 pips, the exchange rate has gone up by 0.001, for example, from 1.1 to 1.101.
What are the risks of Forex trading?
- Market risk: your investment can quickly become less valuable when the markets are highly volatile.
- Counterparty risk: the counterparty with whom you enter into a contract for a currency pair can go bankrupt
- Liquidity risk: your position is closed when you no longer have sufficient margin on your account, this is also called a margin call.
What are the benefits of Forex trading?
- Large market: because the Forex market is very large, it is highly liquid. This means you can actually close your position at any time.
- Stable: the Forex market is relatively stable, which makes it easier to recognize patterns.
- Hedging: with the Forex market, you can hedge your risks. When you buy foreign stocks, you reduce your risk by taking a counter currency position.
- Trading hours: unlike the stock markets, the Forex market is open 24/7.
How much does it cost to invest in Forex?
When investing in Forex, you may encounter various costs:
- Transaction costs: some brokers charge fixed transaction fees for each order.
- Spread: the difference between the bid and ask price can increase.
- Financing costs: you pay daily interest when you use leverage.
For whom is Forex suitable?
Forex is a relatively complex investment product. It is therefore wise to first gain enough experience. When trading on margin, you pay daily financing costs. As a result, Forex trading is often not suitable for long-term investments.
Do you want to gain more experience in investing? Click here to open a Forex demo for free. With a demo, you can try out the possibilities without any risk.
Frequently asked questions about Forex
It is certainly possible to make a lot of money with Forex. When you regularly make the right decisions, you can quickly make more than ten percent per trade by using leverage. Nevertheless, this is far from easy: in practice, more than half of people fail. It is therefore important to practice a lot before you start trading with real money. Read more about it here.
Investing in Forex is buying and selling currencies with the aim of achieving price gains. For example, you buy dollars using euros with the expectation that the value of dollars will rise.
Investing in Forex can be reliable if you choose a reliable broker. However, keep in mind that investing in Forex is certainly not without risks. You can lose your entire investment with investments in Forex.
The average trader tries to make a few percent profit on a monthly basis. When you trade actively, this is possible. However, keep in mind that Forex does not offer a stable income. The Forex markets are unpredictable, so you can always lose money.