
What is yield and the yield curve?
You can use the yield and the yield curve to understand how much your investments bring in. In this article we will discuss what yield is, and we will also take a look at the different yield curves.
What is yield?
Yield shows the returns on an investment over time. Yield is expressed as a percentage of the original investment. All returns are included in the yield: dividend payments on a share and interest payments on a bond are therefore also included.
For some types of securities, the yield is fixed: this is the case, for example, for a bond with a fixed annual interest payment. Many other securities have a variable yield: dividends on shares, for example, can fluctuate sharply depending on the performance of the underlying company.
What is a yield curve?
The yield curve shows visually how much the yield develops over the longer term. This can be shown in a graph, which gives you a line on the graph that shows a certain shape. Usually, this shape is a curved line. This is the curve with which investors can make their predictions for the future.
How can you calculate the yield?
It is easy to calculate the yield. The yield actually shows the cash flow you generate with your investment. You can therefore easily calculate the yield using this formula:
Yield = your net result / your invested amount
Let us illustrate this with an example. When you invest in a share with $10 and the price rises to $12, you achieve a positive price gain. The company also decides to pay out $0.50 in dividend. Your total yield on the share then amounts to ($2 + $0.50) / $10 = 25%.
Is a high yield always positive?
It is always advisable to investigate whether the yield is also favourable in the long term. For example, the yield of a share can be high when the company pays out a lot of dividends. If the company’s income rises little, this can cause problems in the future. The high yield in the short term can then significantly reduce the yield in the future.
What type of yields are there?
You have all kinds of yields. The type of yield depends on the underlying security, the duration of the security and the return you receive.
You can calculate the yield on your shares in two ways. The cost yield shows the return you make on the amount you have invested. You calculate this result as follows:
Cost yield = (price increase + dividend paid out) / price at which you bought the share
You can also choose to look at the yield based on the current market price. We also call this form of yield the current yield; you calculate this value as follows:
Current yield = (price increase + dividend paid out) / current share price
When a share increases in value, the current yield decreases. There is an opposite relationship between the yield and the share price.
Yield over bonds
The nominal yield on a bond is easy to calculate. You do this by dividing the interest payment in a year by the face value of the bond:
Nominal yield: annual interest / face value of the bond
There are also various other yields that can be calculated when investing in a bond. Not every bond pays out a stable interest rate.
Yield to maturity (YTM) = this calculation shows the return that you achieve when you hold the bond until maturity (the moment when the face value is repaid).
Yield to worst (YTW) = this calculation shows the minimum return you would achieve with the bond. In some cases, for example, the issuer of the bond can recall the bond, which reduces the return.
Yield to call (YTC) = this value shows the yield at the time a bond is called back. Only callable bonds can be recalled.
Pay close attention to the yield!
Because there are different ways to calculate the yield of a bond or share, it is important to carefully assess how the provider of the investment product reaches a certain value. This prevents you from investing in a security with too high expectations.
What yield curves are there?
If one fixes the yield of a bond in a graph, the horizontal axis will be the maturity in years and the vertical axis the yield of the security. The curvature of the line that indicates the yield is what we call the yield curve. Here we can distinguish three different forms. The normal, inverse or flat yield curve.
Yield curves are widely used to reflect bond yields. You then see how the yield develops when you buy a bond with a longer maturity.
Normal yield curve
The normal yield curve is a line on the graph that runs slowly from low to high. It is the normal situation where longer-term loans will yield higher returns. Because the horizontal line is the maturity of a loan, the normal yield curve will be an upward curve.
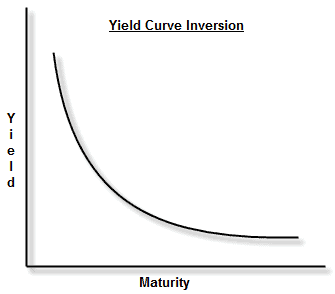
 Inverse yield curve
If a more unusual situation arises in which short-term loans actually yield a higher return, the line in the graph takes a different form. The yield curve is then a line that runs slowly from high to low. We also call it an inverse yield curve. This yield is less common, but is theoretically possible.
 Flat yield curve
A totally flat line in the chart showing the yield of a bond means that a loan yields the same yield for every possible maturity. In practice, this yield curve hardly ever occurs because this is practically impossible. The flat line is called the flat yield curve.
How can you use yield when investing?
Investors can use the yield curve to make decisions about how they want to invest their money in bonds. If you are looking for a long-term investment, then you would like to see a normal yield curve. This indicates that your investment will yield more and more returns over the long term.
However, if you are looking for short-term investments, an inverse yield curve would be ideal. This situation does not happen regularly, but it can give you a large return in a short period of time. However, it should be kept in mind that this often involves a higher credit risk.
Be cautious with conclusions from yield curves
The yield curve is useful for making predictions about the yield of bonds. However, one should be cautious about the conclusions to be drawn from it. The graph can indicate that a loan will yield a certain percentage of return over a period of 5 years. This is by no means a guarantee that this will actually be the case in five years’ time.
There are many factors that ultimately determine whether the return will actually be achieved after the period. These factors are not included in the calculation of the yield. To calculate this, way more complex calculations have to be made.
Auteur

Over Alex Mostert
When I was 16, I secretly bought my first stock. Since that ‘proud moment’ I have been managing trading.info for over 10 years. It is my goal to educate people about financial freedom. After my studies business administration and psychology, I decided to put all my time in developing this website. Since I love to travel, I work from all over the world. Click here to read more about trading.info! Don’t hesitate to leave a comment under this article.