
Reading candlesticks: learn how candlesticks work!
Reading candlesticks allows you to see how the battle between buyers and sellers is unfolding. By learning to read candlesticks, you can make better predictions about future price movements. This explanation is essential for anyone serious about trading the markets.
What is a candlestick?
Don’t be overwhelmed when you first see candlesticks. Japanese candlesticks simply show the price movement within a certain day.
Each candlestick relates to a period: this could be a day or even an hour. You can use candlesticks to perform technical analysis: this way, you can make predictions about price movements.
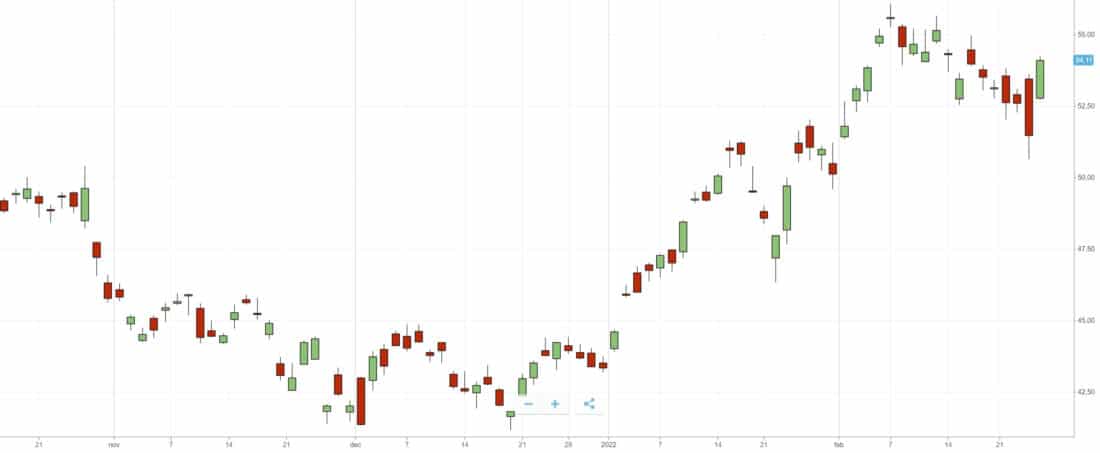
In the above image, you can see what candlesticks look like on a chart
What are the best candlestick brokers?
Candlesticks are especially useful for active day traders. If you want to learn how to use candlesticks, it is recommended to open an account with an online broker. With many brokers, you can practice with a free demo.
How can you read candlesticks?
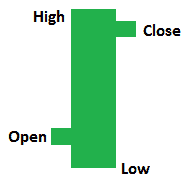
 It is relatively easy to read a candlestick; it contains more information than a regular price line.
- Open: the opening price
- High: the highest point within the relevant period
- Low: the lowest point within the relevant period
- Close: the closing price
The color
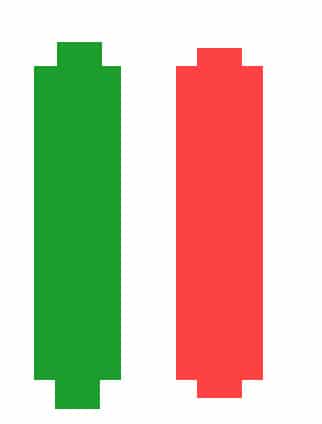
The color of a candlestick indicates whether the price has risen or fallen. Green bars indicate that the price has risen, red bars that the price has fallen.
Period of a candlestick
A candlestick shows how the price has moved within a certain period. The period that the bar refers to depends on the period on which you are analyzing the chart. One candlestick can refer to an hour or a day, for example.
Shadow and body
The wick of the candle shows the price range within that period: this is also known as the shadow of the candle. The body is the thick part of the candlestick and shows the opening and closing price of the period.
A positive, green bar always opens low and closes higher, while a negative, red bar always opens high and closes lower.
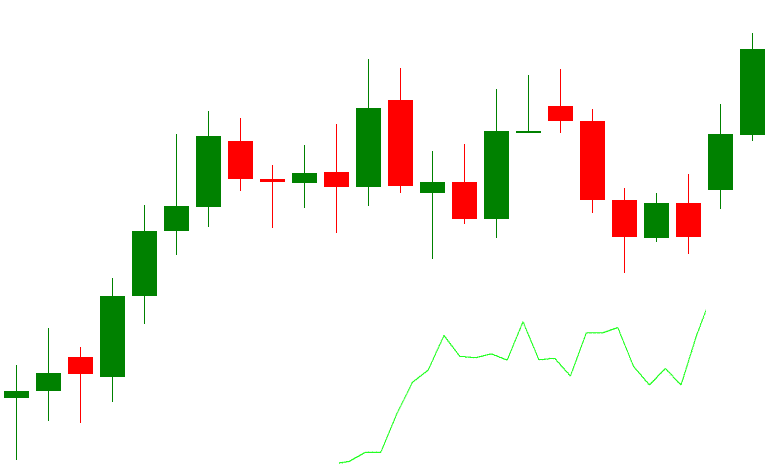
Candlesticks compared to a regular line chart on the daily chart; candlesticks provide more information.
Why candlesticks instead of a line chart?
Professional investors prefer candlesticks over a line chart because it is easy to recognize patterns with candlesticks. When you can read candlesticks well, you can find the turning point in the chart. Investors naturally want to buy at the bottom and sell at the top. In the rest of this article, you will learn how to interpret candlesticks.
The information from candlesticks
Candlesticks provide a lot of information. A large body indicates a strong price movement, while a small body indicates little movement. A short shadow shows that most of the activity took place around the opening and closing prices. A long shadow shows that prices have gone well beyond the open and close prices.
How can you use candlesticks?
Candlesticks are also known as price action. With price action, you can see how the battle between buyers and sellers on the market is going.
When the number of buyers at a certain price increases, the price rises to ensure that there is still sufficient supply. Candlesticks show these developments. When you understand how to read candlesticks, you can better analyze the battle between buyers and sellers.
When buyers have the upper hand, it is wise to buy. When sellers have the upper hand, it is wise to sell. However, it is advisable to always base your decisions on multiple sources of information. For example, see if the price action takes place at an important horizontal level. This way, you increase the chance of achieving a good result with your investments!
What can candlesticks indicate?
- Continuation: the trend continues without any problems
- Trend reversal: the trend goes from rising to falling or vice versa
- Indecision: the battle between buyers and sellers is undecided
In the next part of the article, we discuss various candlestick patterns & their meanings.
Candlestick patterns indicating a continuation of the trend
 These include the bullish and bearish continuation bars. We will discuss the bullish continuation bar; the same characteristics apply to the bearish version.
A bullish continuation bar is a strong indication that the trend will continue. After a bullish continuation bar, there is a high probability that the price will continue to move in the same direction.
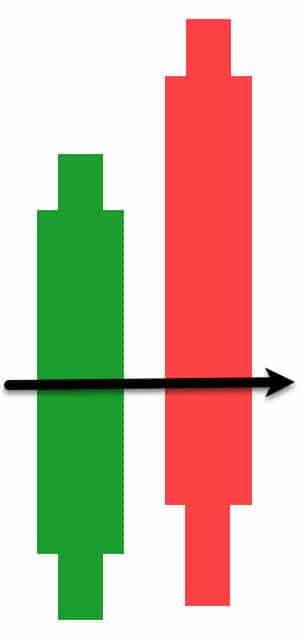
The bar is stronger when the open is close to the lowest point of the bar and the close is close to the highest point. The upward movement is then very strong and has received little resistance from sellers. In the image, you can see an example of both a bullish continuation bar (left) and a bearish continuation bar (right).
Candlesticks that indicate an uptrend
These candlesticks indicate an upward or bullish trend. In this situation, it may be attractive to buy. We discuss the following bullish candlesticks: hammer, bullish engulfing bar, bullish train tracks, piercing line, morning star, and three white soldiers.
Low test or hammer
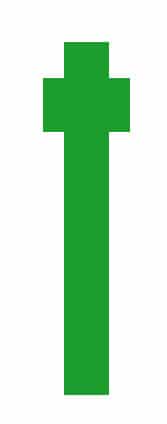 In a low test or hammer, the open and close are in the upper half of the bar, while the price has actually moved down significantly during that period.
The color does not matter here: it is important that despite strong downward pressure, sellers were unable to maintain the downward trend. For a good low test or hammer, the opening and closing times should be in the upper 1/3 of the bar.
The downward movement has stopped, and it is now likely that more buyers will enter the market: the price will then continue to rise.
Bullish engulfing bar
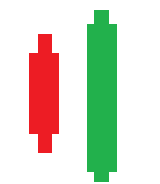 The Bullish Engulfing bar indicates a clear trend movement. You can see how the initial downward movement is being held back and how buyers are gaining strength.
This reversal is visible over two bars, with the first indicating a downward movement. However, the bar is followed by a candlestick where the downward movement is clearly rejected. It is important that the second bar encompasses the entire bar. Also, the bar must close against the upper part. The movement is stronger when the candlestick is large in size.
In that case, it is clear that the sellers who were initially in the majority are being defeated by the buyers who are now in the majority.
Bullish train tracks
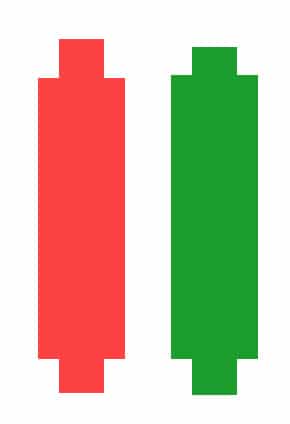 Train tracks
consist of 2 bars. You can encounter both a bullish and a bearish train track candlestick. In the image, you see a bullish train track where the upward trend is rejected.
In fact, a bullish train track can be compared to the low test, but spread over two candlesticks. It is important that the bars are approximately symmetrical and that the highs and lows are approximately equal. If you were to merge the bars, they would form a low test bar. With this pattern, the chance is high that the price will continue to rise.
Piercing line
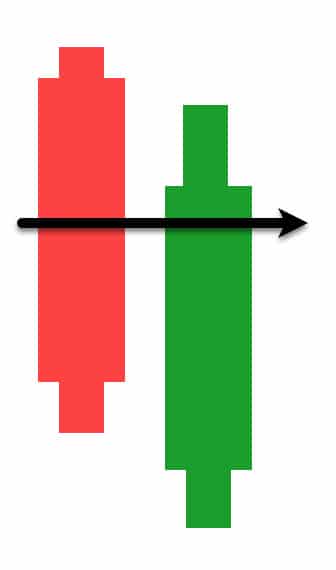 This candlestick pattern consists of two bars. You can see that one long red candlestick is followed by a long green candlestick.
In most cases, you see a big difference between the closing price of the first candlestick and the opening price of the second candlestick. The closing moment of the second bar must be higher than the halfway point of the body of the first bar.
This combination shows strong pressure from buyers. The price is pushed up above the middle price of the previous day.
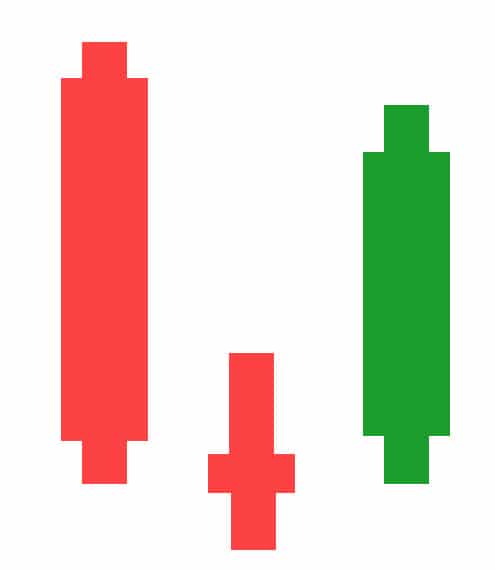
Morning star
Not all candlestick patterns consist of two candlesticks. The morning star pattern is a candlestick pattern that consists of three candlesticks.
The first candlestick is a long red candlestick. This is followed by a candlestick with a short body. The third stick is a long green candlestick.
The middle candle is also called the star. The body of this candle does not overlap with that of the first and last candles. This is a clear pattern that indicates that buyers are taking over from sellers.
Three white soldiers
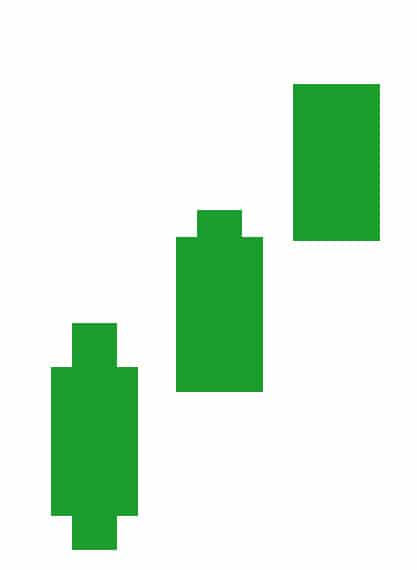 The last bullish candlestick pattern we discuss is the three white soldiers. This pattern also consists of three candlesticks instead of two.
With this pattern, you see three green candlesticks with small shadows. The three candlesticks open higher than the previous one.
This candlestick combination is a strong buy signal and shows that there are buyers taking over.
Candlestick patterns that indicate a falling trend
These candlesticks indicate a bearish or downward trend. In this situation, it may be attractive to sell. We discuss the following bearish candlesticks: the high test, bearish engulfing bar, bearish train tracks, evening star, three black crows, and the dark cloud cover.
High test or inverse hammer

The inverse hammer or high test is the opposite shape of the low test or hammer. This candle is also called the hanging man. In a high test, the open and close are in the lower half of the bar, while the price actually rose significantly during that period.
The color doesn’t matter: it’s about the fact that despite strong upward pressure, buyers couldn’t maintain the upward trend. For a good high test, the opening and closing moments should be in the bottom third of the bar.
The upward movement has stopped, and now there is a good chance that more sellers will come into play, causing the price to drop further.
Bearish engulfing bar
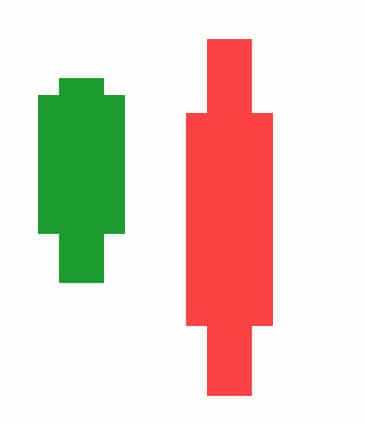 With a bearish engulfing bar, the sellers take over from the buyers, after which the price is likely to drop. You then see a smaller rising bar followed by a large falling bar.
The first candle has a small, green body followed by a longer red candlestick. The strength of the bearish engulfing bar increases when the second candlestick goes much lower. The bearish engulfing bar can be a clear indication of a reversal of the overall market movement.
The bearish engulfing bar is the counterpart of the bullish engulfing bar.
Bearish train tracks
 In the image, you see a bearish train track where the upward movement was rejected.
The bearish train track is similar to the high test, but spread over two candles. In a train track, it is important that the bars are fairly symmetrical to each other and that the highs and lows are roughly equal to each other.
If you were to merge the bars, they would form a high test bar. With this pattern, there is a good chance that the price will then continue to drop.
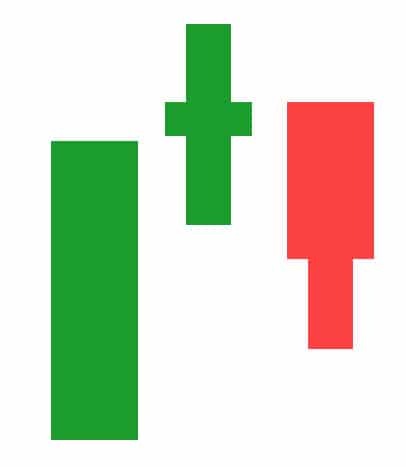
Evening star
The evening star is similar to the bullish evening star. This candlestick pattern also consists of three candles.
In this case, the middle candlestick is sandwiched between a large green candlestick and a large red candlestick.
This pattern shows a clear reversal where sellers take over from buyers. When the situation allows, you can place a sell order here.
Three black crows
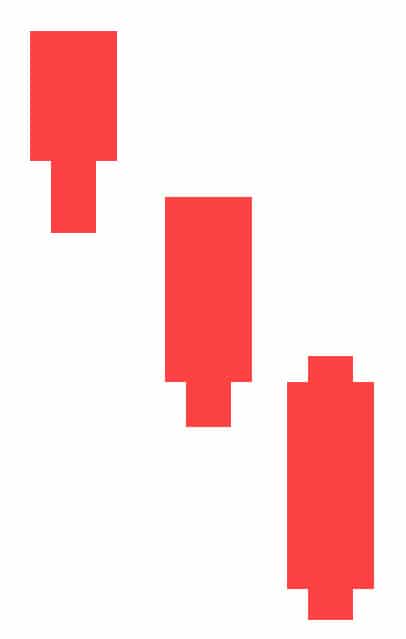 This pattern is the opposite version of the three white soldiers. This candlestick pattern also consists of three candles.
In this pattern, you see three consecutive red candlesticks with a short or absent shadow. Each new candle opens at a similar price to the previous one, but the strength of the sellers drives the price further down.
This pattern can be a clear indication of the start of a downtrend. It may then be interesting to place sell orders.
Dark cloud cover
 The dark cloud cover candlestick pattern is the counterpart of the bullish piercing line. The title is appropriately chosen: the red candlestick brings a dark cloud over the optimism of the previous day.
This candlestick pattern consists of two candlesticks. First, you have a large green candlestick that shows a substantial rise. This is then followed by a red candlestick that originally opens higher than the green candlestick but closes below the middle of the green candlestick.
This pattern clearly shows that the rise cannot be sustained. Sellers win over buyers, and the price shows a clear decline. This may be a good time to place a sell order.
Candlestick patterns that indicate indecision
Sometimes, there is no clear trend. These candlesticks can indicate indecision in the market. When there is indecision, there is a good chance that the market will continue to move in the same direction. In some cases, the price may also suddenly break out strongly in the opposite direction.
Inside bars
 Inside bars are bars that fit within the high and low of the previous bar. Inside bars often indicate a certain degree of indecision: no one knows which direction the price is going. The color of the bars is not important in this case. After an inside bar, a strong upward or downward movement may follow.
Sometimes, there are also double inside bars, where an even stronger degree of indecision applies. Buyers and sellers could not push the price further down or up, so the price has no clear direction at the moment. A strong breakout can be expected. On the left, you can see an example of double inside bars.
Doji bars
 In a doji bar, the open and close are almost symmetrically aligned, while the price has moved both up and down. This is an indication of strong indecision, where the battle between buyers and sellers is not yet fought out. The color does not matter in this bar.
A doji bar alone is not a good reason to take a position. Therefore, wait for new candles before making a decision.
In combination with the bullish morning star or bearish evening star, a doji bar can be used to open an investment.
Spinning top
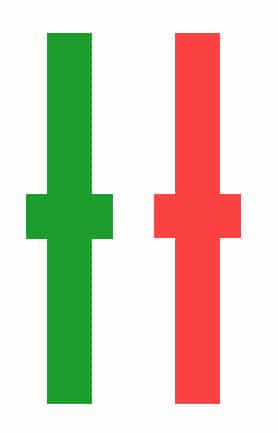 The spinning top is also a candlestick that indicates indecision. In this pattern, you see a small body with a large shadow. There is no clear price movement.
You can see that both buyers and sellers have pushed the price up and down considerably within the time period. However, there is still no clear winner. There is a period of calm.
Falling & rising three methods
The falling & rising three methods show a continuation of the bullish or bearish trend.
The bullish pattern you see on the left is called the rising three methods candlestick pattern. It consists of three short red candlesticks between two long green candlesticks. The pattern shows that despite pressure from sellers, buyers clearly maintain control.
The bearish pattern you see on the right is called the falling three methods pattern. Here, you see three small green bodies between two large red candlesticks. Here, you can see that despite some pressure from buyers, sellers clearly maintain control. Both patterns are continuation patterns.
How can you use candlesticks?
Almost every broker allows you to use candlesticks. In this part of the article, we’ll look at how you can add candlesticks to your chart.
Within Plus500
Plus500 is a user-friendly broker where you can trade CFDs in currency pairs and stocks. Want to know more about this broker? Then read this article!
Click on the button switch between candlestick/line to use candlesticks in Plus500.
![]()
Candlesticks within DEGIRO
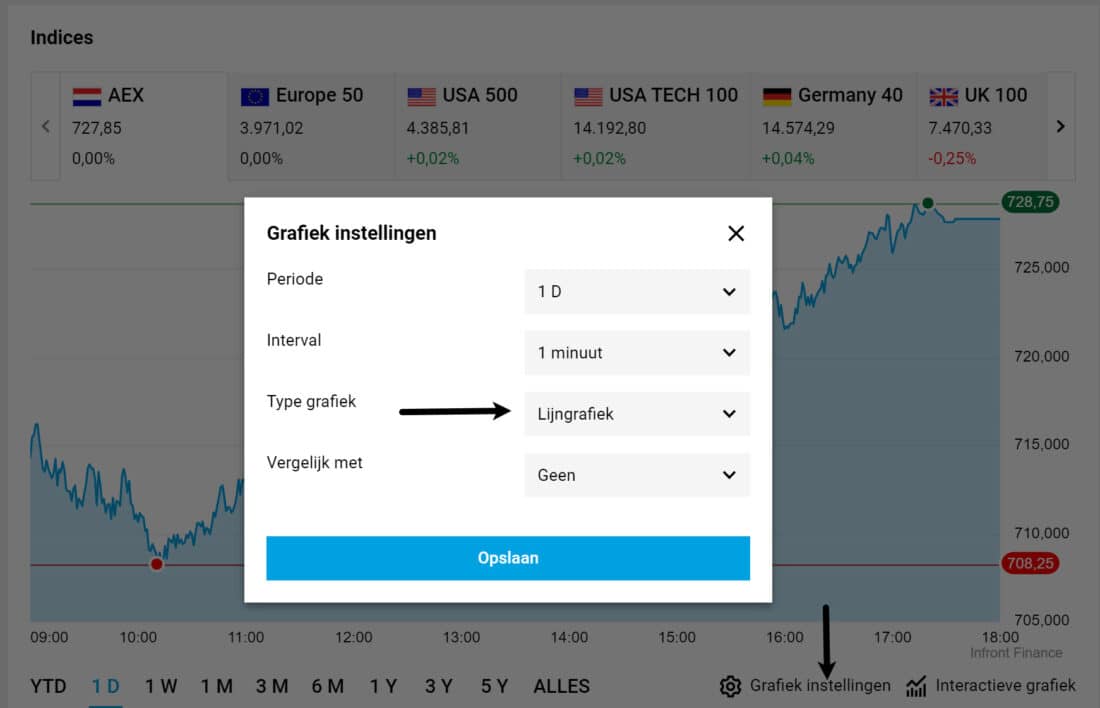
You can enable candlesticks within DEGIRO by clicking on Chart settings. You can then select the correct chart type under Chart type.
Candlesticks within MetaTrader
By default, MetaTrader displays the price as a smooth line. However, a line provides little information, so it’s wise to change it to candlesticks. You can do this easily by clicking on the candlesticks button.
![]()
Tip: Practice Recognizing Candlesticks
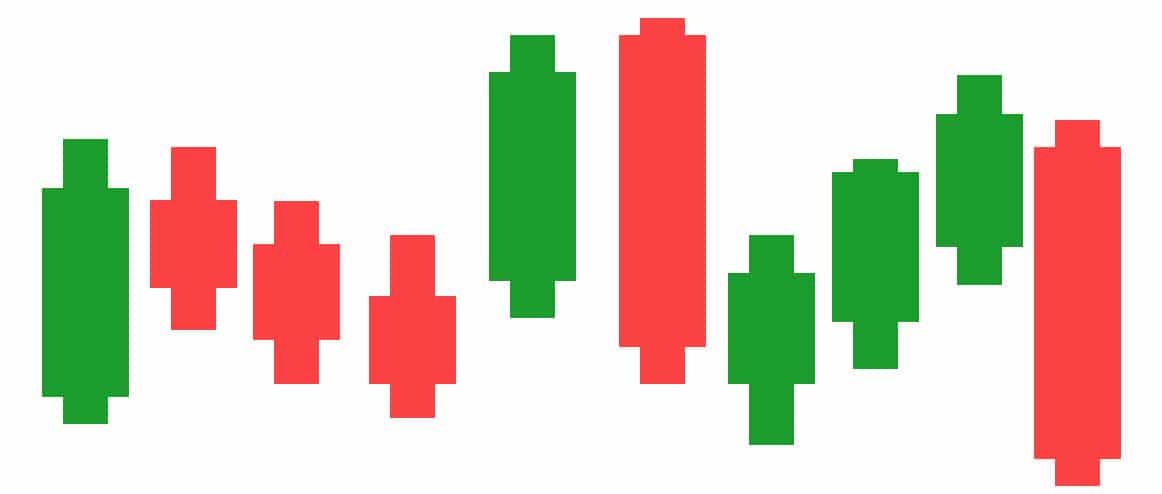
Below is a chart with candlesticks. Try to recognize the different bars, name them, and think about what they mean exactly. By practicing a lot, you will learn to recognize candlesticks faster and predict prices better.
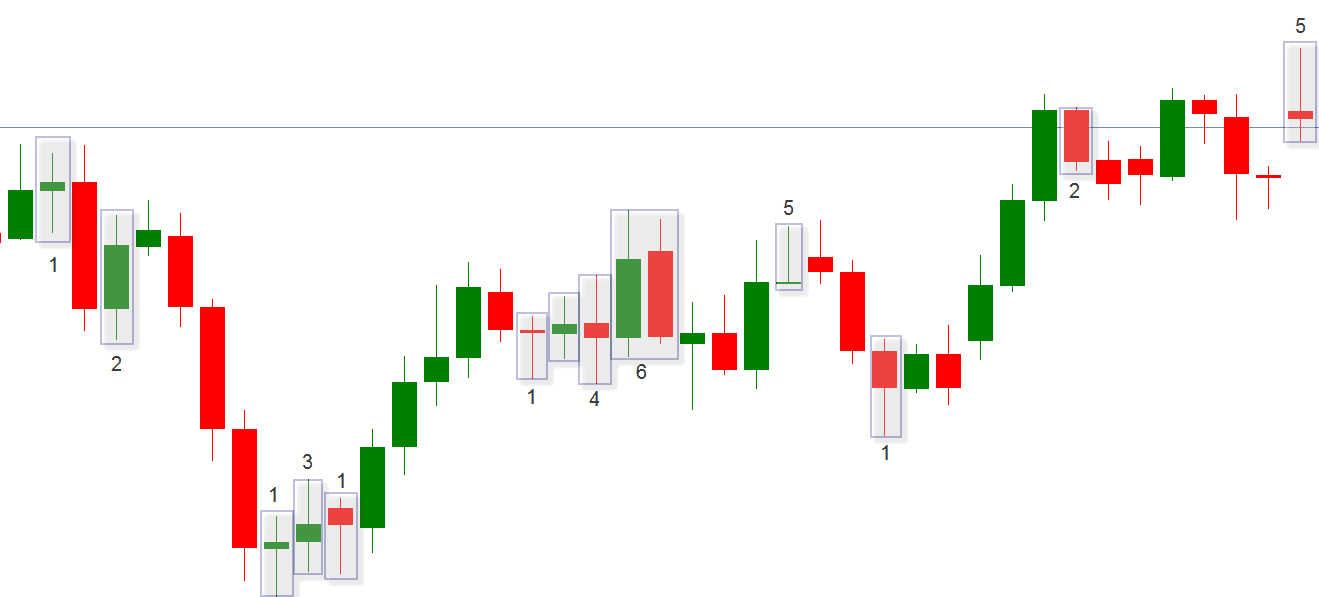
- 1: low test: the buyers win from the sellers, the price may rise
- 2: inside bar: there is indecision in the market
- 3: doji bar: there is indecision in the market
- 4: doji bar: there is indecision in the market
- 5: high test: the buyers lose to the sellers, the price may fall
- 6: train tracks: the sellers win from the buyers, the price may fall
Can you predict prices with candlesticks?
Candlesticks or price action are a good indication of the expected next movement. As seen in the previous paragraph, a candlestick is never decisive in determining the direction of the price. It is very important to take market conditions into account before opening an investment. Therefore, read how to recognize a trend or continue learning in our technical analysis course!
Do you want to practice using candlesticks yourself? This can be done completely risk-free! Open a free demo investment package and practice recognizing these patterns:
How can you use candlesticks to take a position?
When you have found a good moment to open an investment, you can also use candlesticks to bet on when to enter. A position always consists of two important elements: an entry point and a stop loss. The entry point is the moment you open an investment and the stop loss is the moment when you take a loss if the position moves in the opposite direction.
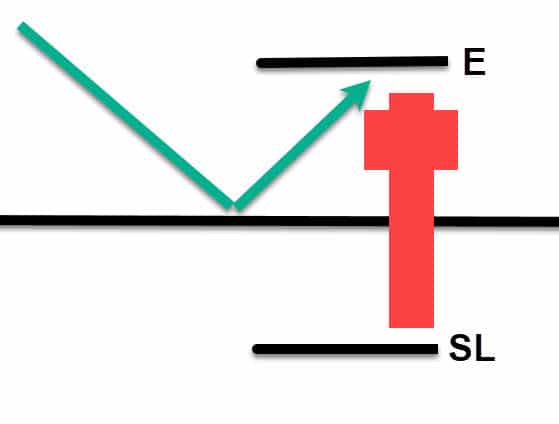
In this example, we open a position based on a hammer candlestick. The price of a currency pair has been falling for a while and is now hitting a strong horizontal level. Here, this pattern forms, which may indicate that the price will rise.
You can then choose to place the entry point just above the candlestick (E). If the price unexpectedly moves in the opposite direction, you avoid opening a losing position.
At the same time, you can place the stop loss (SL) just below the candlestick. If you open a position and the price still moves in the opposite direction, you ensure that you do not allow the losses to accumulate further.
So you can use candlesticks well to plan your investments. This way you minimize potential losses and maximize potential profits!
History of Candlesticks
Candlesticks have a rich history. The origin dates back to the 17th century. The Japanese wanted to increase profits from the sale of rice and found candlesticks helpful in analyzing price patterns. Charles Down expanded this concept in 1900 and brought the instrument to the level we know today.
Candlesticks focus entirely on ‘what‘. Candlesticks show what is happening, but do not try to explain it. Therefore, candlesticks can only be used for technical analysis. To perform such an analysis, we use a list of characteristics:
- All information is displayed in the current price.
- Expectations and emotions drive the markets.
- The markets are constantly in motion.
- The current price may not be equal to the actual value.
Frequently Asked Questions about Candlesticks
Candlesticks provide much more information to investors than a normal line chart. With a candlestick chart, you have a better picture of the price and can make predictions about future price movements.
Candlesticks can be complicated, especially for beginner investors. It takes time to analyze candlestick patterns and the chart can look different on different timeframes. Analyzing candlesticks is not an exact science.
You can use candlesticks for every type of investment. Many day traders use candlesticks to analyze currencies (Forex), but you can also use candlesticks to predict the price of cryptocurrencies, stocks, and ETFs.
Extra: OHLC Bars
 An alternative way to display price action is through the so-called OHLC bars. OHLC bars provide similar information to candlesticks; the presentation is just different. In an OHLC bar, the left bend is the price at which the period started and the right bend is the price at which the period ended.
Auteur

Over Alex Mostert
When I was 16, I secretly bought my first stock. Since that ‘proud moment’ I have been managing trading.info for over 10 years. It is my goal to educate people about financial freedom. After my studies business administration and psychology, I decided to put all my time in developing this website. Since I love to travel, I work from all over the world. Click here to read more about trading.info! Don’t hesitate to leave a comment under this article.