
What is the average return on the stock markets?
Are you curious about the average return on stocks and other investments? In this article, we list the average returns! After reading this article, you will know what returns you can expect from investing. We also show you the easiest way to achieve an average return. And for the real risk-takers, we also investigate how to beat the market with above-average returns.
Summary of average returns
- The average return on stocks is approximately 7-8%.
- The average return on bonds is approximately 5%.
- You must consider inflation: the real return is different.
- The volatility or fluctuations of the stock prices is also important.
- The average return you achieve depends on your portfolio.
What is return?
Everyone who invests is trying to achieve a return. Return is the positive or negative result you get from an investment.
For example, if you buy a stock for $100 and the price rises to $110, you achieve a return of $10 or 10%.
How to determine the average return?
The average return is the result you would achieve over a certain period. However, there is no objective average return: for example, the average return on stocks in one year can be 50%, while in a period of 5 bad years, it can be -5%.
Therefore, you always need a benchmark: for example, are you looking at the return on American or European stocks? And are you looking at a period of 1, 10, or even 100 years? Always pay attention when you read about ‘the average return.’
Pay attention to the volatility
On most websites, the average return on stocks is estimated at 8%. However, this does not mean that you will receive this return credited to your account every year.
For example, between 2012-2021, the average return on stocks in the S&P500 was 14.8%. However, you would not have achieved a return of exactly 14.8% in any year:
- In one year, you lost 4.4%
- In one year, you would have gained a 2% return
- In 4 years, you achieved a return of more than 20%
- In 4 years, you achieved a return between 12 and 19%
To achieve the average return in a period, it is important to invest during the periods with the highest returns. Between 2012 and 2021, the return was more than 30% in 2 years, which compensates for the slow years. Unfortunately, it is often not possible to predict which years will perform well.
Volatility causes fluctuating returns on stocks
A good way to reduce the volatility of your entire portfolio is by investing in a diversified manner. For example, invest a fixed amount every month in an index fund. This allows you to invest both at low and high prices, which ensures that you achieve an average return.
What is the average return on stocks?
According to Warren Buffett, a famous stock trader, the average return on stocks should be between six and seven percent. He believes that the Gross Domestic Product (GDP) increases on average by three percent in the long run and that there is an additional two percent inflation. This leads to a nominal growth of the total economy of five percent.
However, companies also pay dividends, which on average can provide a return of six to seven percent. Naturally, you will only receive this increase in the value of your stocks over the long term. If you had invested in 2008, your average return would have been much lower in the beginning.
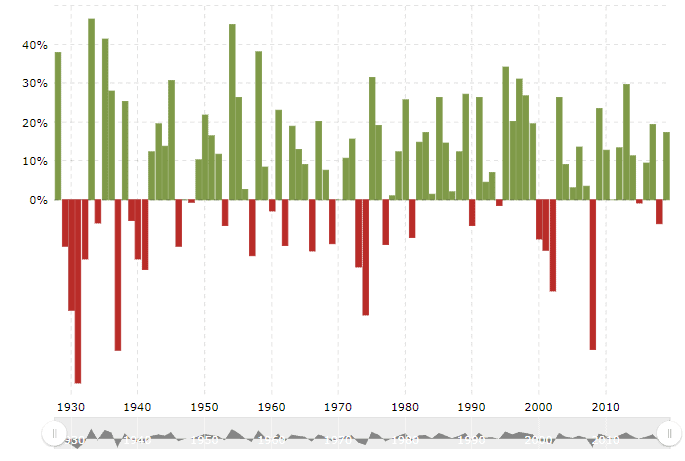
As shown in the graph below from Vanguard, stocks have indeed achieved a high average return in the past period.
The return you achieve strongly depends on the period in which you invest:
- In the 10 years between 2011 and 2021, the return was 14.8%
- In the 20 years between 1992 and 2021, the return was 9.9%
- In the 50 years between 1972 and 2021, the return was 9.4%
Difference between nominal and real returns
It is also important to consider the difference between nominal and real returns.
The nominal return is the return you receive directly on your stocks. If a stock rises from $10 to $20, your return is 100%.
When calculating the real return, the inflation is also considered. Goods and services are becoming pricier, which means that with the same amount of money, you can buy less. This increase in prices is also known as inflation.
If the prices of goods and services increase by 100%, you would not have made any real return even with a 100% return, since you still can’t buy anything extra with the return. Therefore, it is essential to consider inflation when determining your average stock return.
How to achieve an average return?
If you want to achieve an average return over a longer period, you can use ETFs.
An ETF tracks a specific index, such as the S&P 500 or the AEX. By depositing a fixed amount each month, you can benefit from the average return on the respective index.
Are you curious which brokers allow you to invest in stocks with an average return? Below, you can see where to get started:
| Brokers | Benefits | Register |
|---|---|---|
| Buy without commissions. Your capital is at risk. Other fees may apply. | ||
 | Speculate with CFD's on increasing & decreasing prices of ! 82% of retail CFD accounts lose money. | |
 | Benefit from low fees, an innovative platform & high security! | |
 | Speculate on price increases and decreases of with a free demo! |
It is important to take enough time: only when you invest long enough can you come close to the average return. When you invest in a bad year, you can easily lose 10% or more. However, the chances of a high return are great in the long run. With the tool below, you can calculate how your wealth grows over time when you invest regularly:
Can you achieve a higher return than average?
Some investors manage to beat the market: they achieve an above-average return. This is very difficult, however. Moreover, if you want to achieve an above-average return, you must take more risks.
If you would like to achieve the highest possible return, you must analyse individual stocks. You will then have to select pearls that produce good results year after year. Warren Buffett has done this by selecting value stocks with a good track record.
It is also possible to achieve a high return on shares in the short term. You then react to the latest market developments by speculating.
On the short term, you can achieve high returns. On the short term mass psychology plays an important role. When bad news hits, the masses often panic. By responding smartly, you can sometimes easily achieve a hundred percent return on a single investment. Have a look at the graph below; this was a great moment to invest!
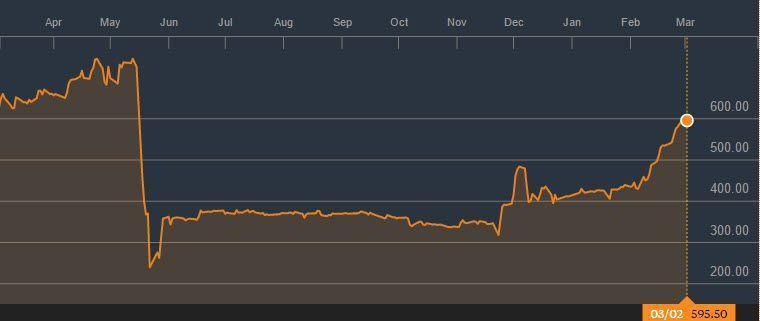
Do you want to try active speculation? Click here to open a free demo account with a broker. This allows you to test if active speculation fits you.
What is the average return per region?
You can also break down the average return by region. Not every region has performed equally well since 1900. The graph below shows the average annual real return per year. Australia has performed the best, while European countries like Italy and Belgium have not performed particularly well.
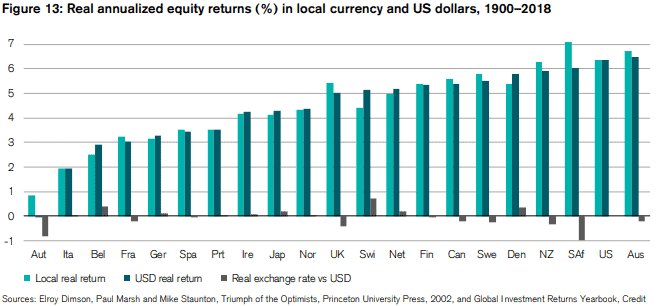
When you invest, you can spread your risks across different regions. This prevents you from putting all your money into a region that is, on average, not performing well. It is also interesting to keep an eye on demographic developments. Many Western countries are ageing, which may slow down growth. At the same time, there is still a lot of potential in emerging markets, where prosperity is steadily increasing.
What is the average risk-free return?
When you invest, you get paid for the risk you take. There is also the so-called risk-free return. The risk-free return is the return you earn with (almost) no risk. Typically, the average 10-year bond yield of government bonds is used to determine the average risk-free return.
In the past, the average risk-free return in Europe was 4%. Nowadays, however, this rate is negative! When the average risk-free return is very low or even negative, investors will be more willing to take risks to achieve a positive return.
However, in 2023 and 2024, under the influence of high inflation, the risk-free return became positive again. I believe this will soon change again as inflation decreases.
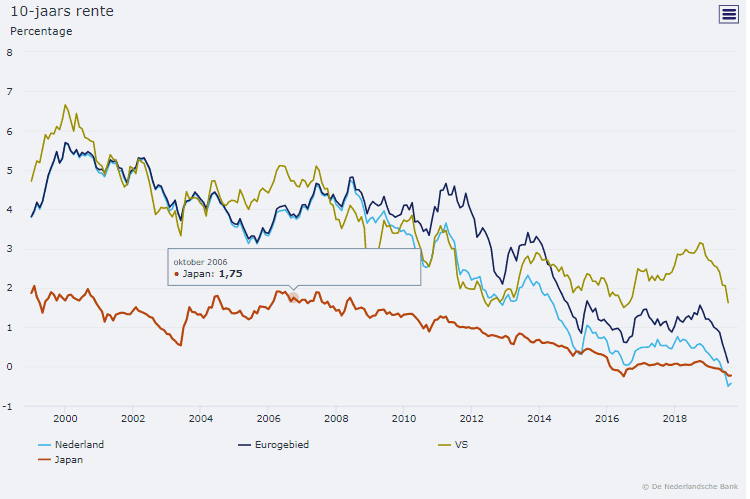
Since the risk-free return was negative, there has also been a considerable rally in stock prices recently.
What is the average return on other investments?
Average return on bonds
Some people prefer to invest in bonds. The average return on bonds in the United States was 5.3% between 1926 and 2008. It is therefore a good rule to assume a nominal average return of 5% in the long run.
Average return on real estate
Real estate can be a potentially interesting investment. Especially in recent times, real estate prices have risen enormously: in a few years, you pay almost double. Because you can invest in real estate with borrowed money, your returns can increase quickly.
However, there are some cracks in the armour: when interest rates rise, this can put growth under pressure. The average return on real estate over a longer period is around 5%.
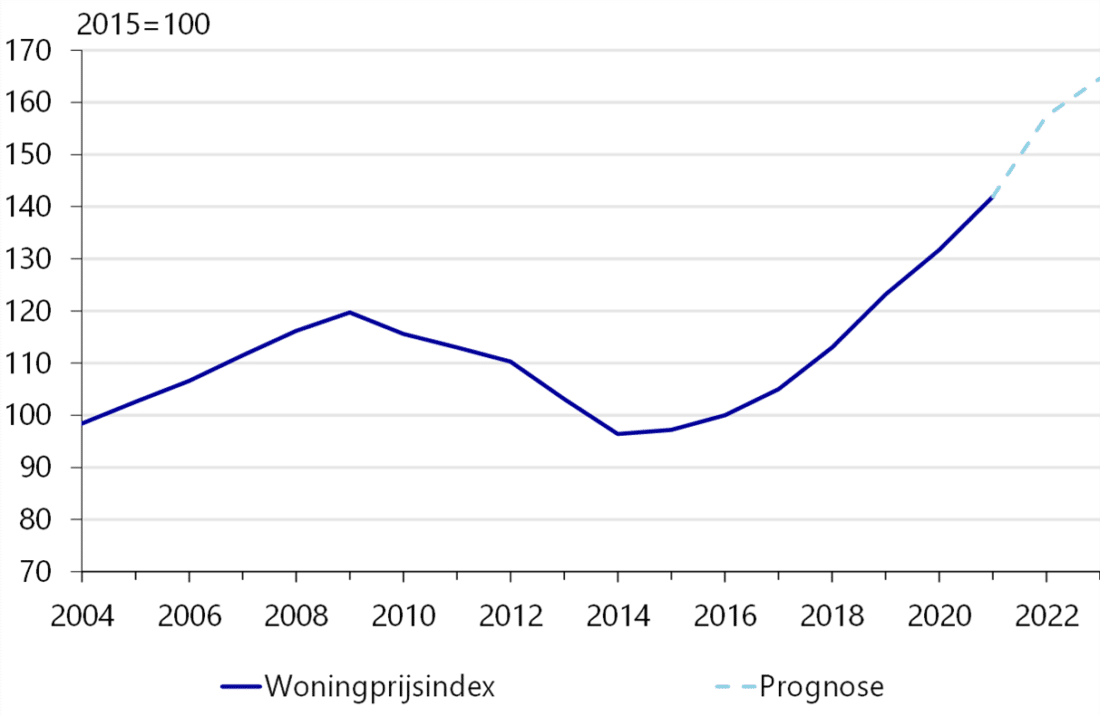
The development of house prices in the Netherlands. Source: Rabobank
Average return on cryptocurrencies
Crypto is still relatively new, but certainly not unknown. The average return on crypto over the past 10 years has been extremely high. At launch, Bitcoin was worth less than a penny. Meanwhile, in 2024, the price fluctuates between $50.000 and $75,000.
Because cryptocurrency is now well-known, it is no longer possible to achieve astronomical returns by investing in well-known cryptocurrencies. Crypto is very speculative, and it is difficult to determine an average return. When you take a good ‘bet’, you can earn a very high return, while you can also easily lose your entire investment within a few days. Therefore, be careful with investments in crypto.
Average return on commodities
You can also invest in commodities such as gold and silver using by derivatives. The average return on commodities fluctuates widely and depends on supply and demand. Prices of many commodities are likely to rise in the long term as they are scarce and running out. However, the average return in the past hundred years has been significantly lower than that of stocks.
What is the best investment?
Research shows that stocks on average yield the highest return. For example, Professor Russell E. Palmer of the University of Pennsylvania states that shares have historically yielded much more than bonds.
If you had invested one dollar in the stock market in 1802, it would have been worth $8.8 million in 2023! The return on bonds would have only been $16,064, and with $4,575 the return on government bonds would be even lower. The return on gold would have been $19.75. Note that dividends are reinvested in these calculations.
So… should you always trade in stocks?
It is clear that over time the average return on stocks was the highest. Does this mean that it is only wise to trade in stocks? No, that’s a bit simplistic! Although stocks generally offer the best return, they often also carry the greatest risks.
For example, if you were to invest one dollar in stocks in 2008 and measure it until 2010, there would be little left of your investment. If you want to pursue a maximum return instead of an average return, it is wise to remember that individual securities can deviate significantly from the average.
Model portfolios & returns
Using a model portfolio, you can see what the average return would be in different situations. We used the model portfolios set up by Vanguard for this purpose.
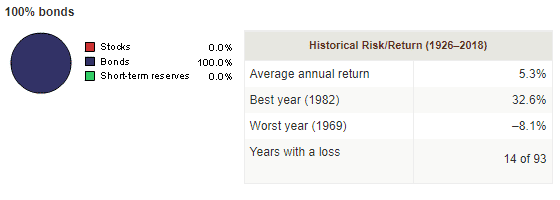
Safe portfolios
Below, you can see the results you would have achieved with a portfolio consisting almost entirely of bonds. This method of investing is also called defensive investing. This name is applicable because the average volatility on bonds is lower. You can see the average return of a defensive portfolio below:
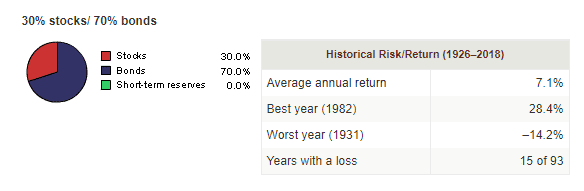
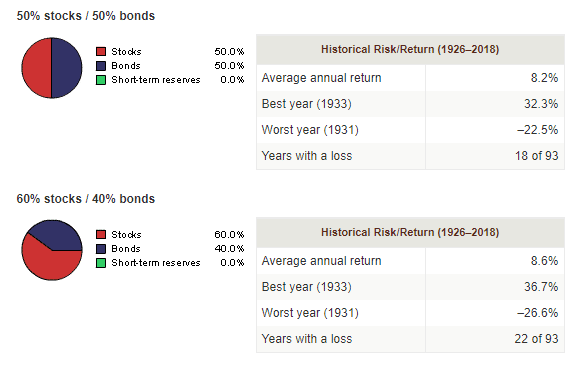
Mixed portfolios
People who can tolerate more risks and volatility typically opt for a more mixed portfolio. This type of portfolio is also known as “neutral”. It provides a balance between bonds and stocks, with a focus on medium-term gains. The following results can be expected with this type of portfolio:
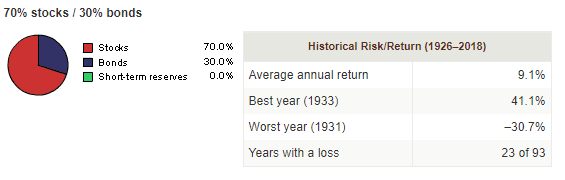
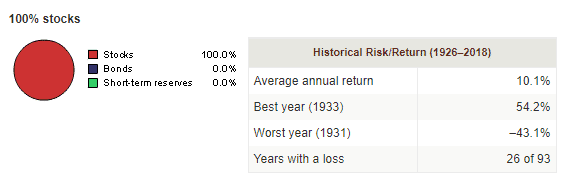
Aggressive portfolio
If you have a long-time horizon (15 to 30 years), you may consider an “aggressive portfolio.” This type of investing focuses on growth and mostly invests in stocks. The average return is higher, but the volatility is also much higher. The following historical results can be achieved with a more aggressive portfolio:
Expected Returns: What is a Realistic Return?
But what kind of investment return do investors actually expect? A study by Schroders indicated that investors expect an average return of 10%, while millennials expect 12%. These are quite high percentages, and the likelihood of these investors being disappointed is high.
Older investors appear to have gained a more realistic view over the years. Baby boomers expect an average return of 8.6% per year. The older someone is, the lower their expected average return.
Professional investors appear to make better predictions. Research has indicated that they aim for about 5% per year. Expected average returns also vary greatly by region. For example, people living in Indonesia expect an average return of 17.1%, while those living in Italy expect 7.1%.
Ultimately, when investing, it is important to have realistic expectations about the average return you can achieve. Don’t set your expectations too high! Disappointment is a poor adviser which can negatively impact your decision-making abilities.
Beware of Unrealistic Expectations
Sometimes on the internet, you may come across parties promising a very high average annual return. When you read this, it is essential to be very sceptical. There are not many funds or parties that can achieve such high returns. Even one of the world’s best investors, Warren Buffett, does not achieve more than an average return of 20% per year.
Therefore, always conduct extensive research into the source of the return. How realistic is it that this average return will continue? Is it a matter of luck, or is the strategy truly unique and exceptionally smart? A critical attitude is indispensable for every investor.
How can you calculate the return on investments?
You can easily calculate the return on your investments over a period of time. You will need the following information:
- The price at which you opened your investment.
- The current price of your investment.
- The number of years.
Then, follow these steps to calculate your return:
- Calculate the difference between the purchase price and the current price.
- Divide this amount by the number of years you have held the investment.
- Then, divide this amount by the price at which you opened the investment.
This allows you to calculate the nominal return on your investment. If you want to know the real return, you need to subtract the average inflation during the period of your return. For example, if inflation is two percent, then you subtract two percent from the average return.
Frequently Asked Questions
Ultimately, you have to determine what a reasonable return is for yourself. Some people invest only to preserve their wealth, while others invest to achieve high returns. Realistically, you can expect an average return of 5% on bonds and 8% on stocks.
Return and risk are inextricably linked. For example, with cryptocurrency investments, you can easily achieve a return of 100% or more in a short period of time. However, this comes with a high risk: you won’t be the first investor to lose a significant amount of money on your investments.
When you only look at the average return, you don’t have the full picture. For example, the average return in America since 1900 was 10.1%. However, this is the return before inflation. Inflation is the process by which prices increase annually. A year later, you can buy less for the same amount.
The real average return is the amount of return you have after subtracting inflation. This return is much lower. For example, the real return on shares in America was 6.4% per year.
If an average return is mentioned somewhere, always check whether it is a nominal or real return. Furthermore, always look at the measurement period used. For example, many funds report the average return from 2009 to 2019. The 2008 economic crisis is conveniently left out of the calculation.
Auteur

Over Alex Mostert
When I was 16, I secretly bought my first stock. Since that ‘proud moment’ I have been managing trading.info for over 10 years. It is my goal to educate people about financial freedom. After my studies business administration and psychology, I decided to put all my time in developing this website. Since I love to travel, I work from all over the world. Click here to read more about trading.info! Don’t hesitate to leave a comment under this article.