
Relative Strength Index (RSI) investing explanation
The RSI or Relative Strength Index is a powerful indicator to check whether the current up or downtrend still has room to continue. In this explanation you can read all about the Relative Strength Index so that you can apply it to your investments.
What is the Relative Strength Index or RSI?
The RSI is a technical indicator that measures how often the price of a currency pair or share closes higher compared to the number of times the price closes lower. This value is then compared to several time periods where the most recent data is the most important. These measurements yield a value between 0 and 100.
The calculation of the RSI is as follows: 100 – (100/ (1 + (average increase / average decrease). Consequently, the RSI shows the ratio between average increases and decreases. The average increase is calculated by continuously comparing the closing price with that of the day before.
A figure above 70 indicates that the pair has been overbought, a figure below 30 indicates that the pair has been oversold. Some investors prefer values of 80 and 20 as this provides even more certainty. When an overbought or oversold situation occurs, you should not immediately take a trading position. The RSI is only an indicator and for that reason, it is important to look for other indicators.
How do you set up the RSI?
Inside Plus500
A good broker for trading using the RSI is Plus500. Click here to read more about Plus500 and to create a free demo account.
Within Plus500 it is straightforward to set up the RSI. To achieve this, go to the indicators setup via the toolbar and select the Relative Strength Index. By default, the index is set to 14, but it is wiser to use 6 as a value.

Inside MetaTrader
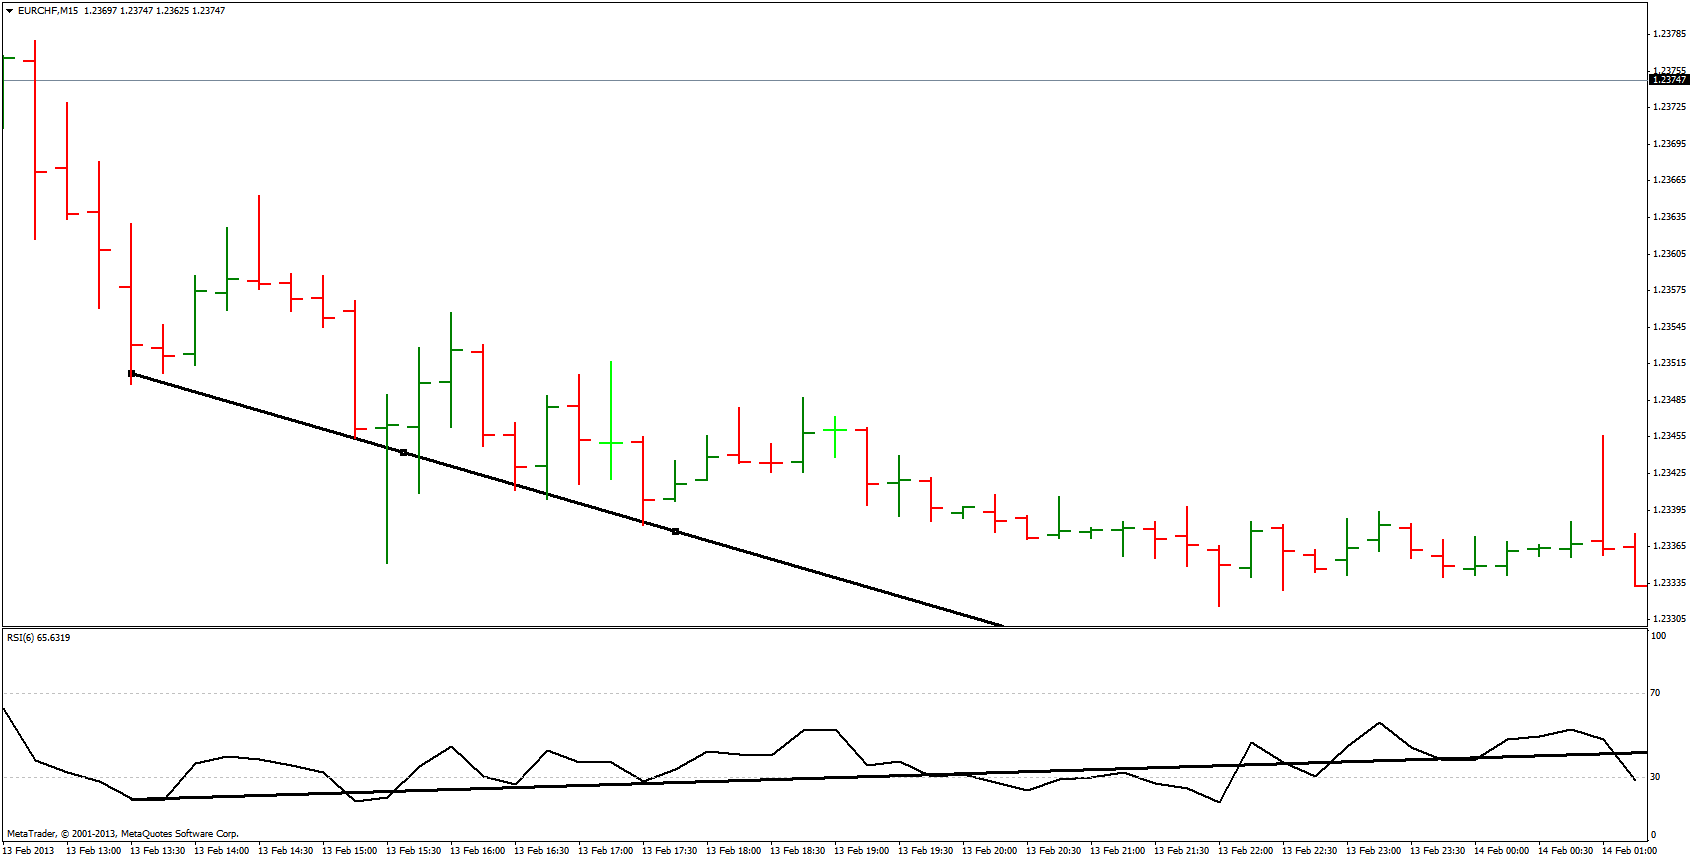
Likewise, within MetaTrader it is easy to set up the RSI. To accomplish this, use the toolbar to go to insert, indicators, oscillators, and Relative Strength Index. Use 6 as the period and thicken the line so that it is easier to read.
What is the basis of the RSI?
Many investors use the RSI to determine if there is still a good entry point. For example, many traders see an overbought signal as an indication that you should no longer buy. After all, there are already many investors who have bought the relevant share or currency pair.
However, this is a little too short-sighted. An overbought status can also be a sign of strength. Trends can grow and strengthen. Consequently, in a case like this, you might miss a great opportunity. Hence, it is wiser to look at divergence and convergence within the Relative Strength Index.
How to use the RSI?
You can use the RSI to check if the current trend still has power to grow. In case of convergence this can still happen, with divergence there is some doubt and a reversal may occur.
Convergence
In the case of convergence, the RSI is in line with the trend and the trend is likely to continue
- Bullish: both price and RSI attain greater highs
- Bearish: both price and RSI attain lower highs
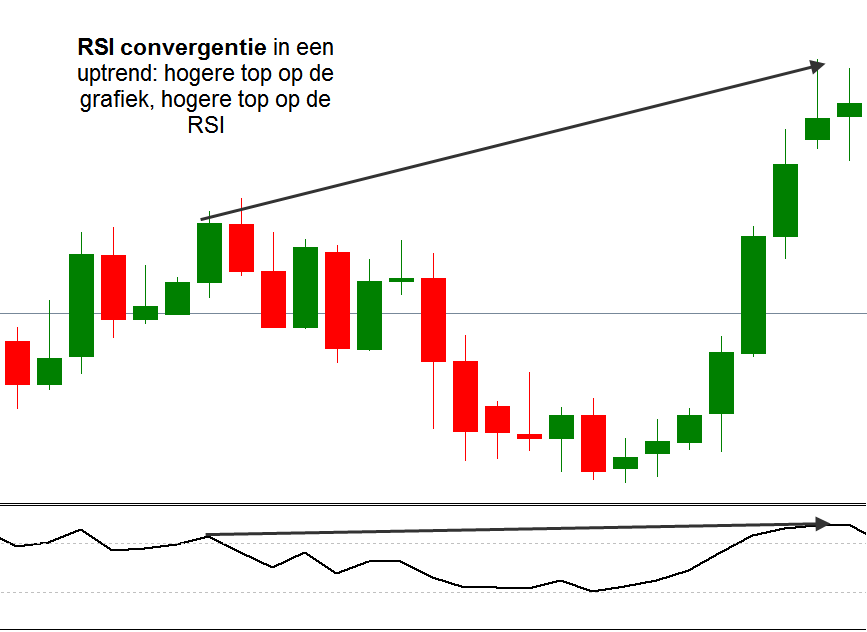
RSI convergence in an uptrend: a higher top on the graph and a higher top on the RSI
Divergence
In case of divergence, the RSI is not in line with the trend and a reversal can occur.
- Bullish: the price attains greater highs, yet the RSI attains lower highs
- Bearish: the price attains lower lows, but the RSI attains higher lows
A higher top is formed, but the RSI attains a lower top… this is RSI divergence!
Application of the RSI
The RSI is of value to test your perception of the current market circumstance. Convergence confirms the current trend, while divergence indicates that the trend may reverse. By taking this into account, you can take more successful positions and make more profit with Forex and shares.
The RSI is also essential when taking a position on a trend reversal: only in case of divergence it is wise to take a position on a trend reversal. The RSI is therefore especially useful when you want to open an investment on a trend reversal.
Relative Strength Index and 50
You can also use the RSI to estimate the current trend. When the RSI is above 50 there is an upward trend, and when it falls below 50 there is a downward trend.
If the RSI is above 50, this may be a reason to buy. When the RSI then decreases to below 50, it is time for you to sell again. However, keep in mind that this is only one indicator. Do not decide based solely on the Relative Strength Index!
Adapt the RSI to the present situation
It is important to remember that 70 and 30 are defaults that are not always usable. For example, if a stock is in a clear downward trend, it may be wiser to lower the overbought level. At that time, you can draw a horizontal level within the RSI at 50.
Auteur

Over Alex Mostert
When I was 16, I secretly bought my first stock. Since that ‘proud moment’ I have been managing trading.info for over 10 years. It is my goal to educate people about financial freedom. After my studies business administration and psychology, I decided to put all my time in developing this website. Since I love to travel, I work from all over the world. Click here to read more about trading.info! Don’t hesitate to leave a comment under this article.