
Support & Resistance with trend lines & horizontals
Support and resistance play an important role in successful trading. These levels indicate at what moment the price of a share or Forex pair is likely to move in the opposite direction. You can use these levels to find a good time to open a trade or investment.
What are support & resistance?
- The support level is a low level that the price cannot seem to break through (bottom).
- The resistance level is a high level that the price does not seem to be able to break through (ceiling).
The interesting thing about support & resistance is the fact that as soon as these levels are broken, they often switch. An old support level can then switch to a resistance level and a resistance level can then switch to a support level.
Resistance and support show the battle between buyers and sellers. Breaking this level could indicate a trend reversal.
The struggle between buyers and sellers
Every second of every day buyers and sellers compete. This applies to all securities: it does not matter whether you trade in stocks or Forex. The price will therefore never move in a perfect, straight line.
There is always a certain degree of resistance in a rising trend. People who take their profits and sell their positions put pressure on the rising trend.
There is always a degree of support in a downward trend. At low prices, more people are interested in getting in, so that the price can rise again.
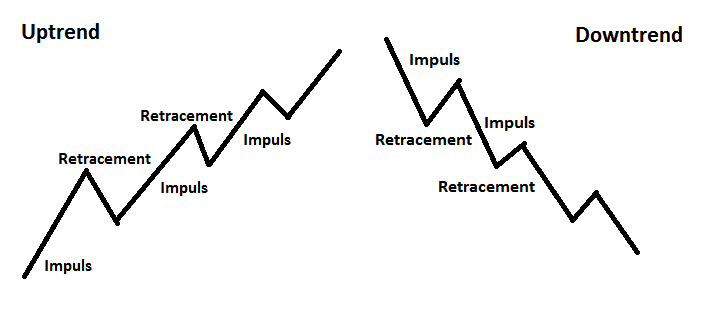
You see this pattern in every price movement. The price is moving in a dominant direction. We also call these dominant movements impulses. However, the price regularly moves in the other direction in between. We call these movements in the other direction retracements.
How can you invest at these levels?
There are two ways in which you can use support and resistance levels for your investments.
Trade on the bounce
- You open a position when the price falls to a support level.
- You open a position when the price rises to a resistance level.
Trade on the break
- You open a position after the price breaks through the resistance.
- You open a position when the price falls through the support.
Trading on the bounce is easier for many people as these patterns last longer. As a result, it may be easier for the novice investor in Forex and stocks to trade with the trend.
Testing levels
Resistance levels and support levels are not an exact science. It therefore regularly happens that a level is temporarily broken and then returns to the old pattern. We also call this a level test. Therefore, always pay close attention to whether a level has been broken, or whether there is a so-called false breakthrough.
Recognize the levels
Before you start investing with support and resistance levels, it is important to understand a few things. You have to remember that after a breakthrough, a resistance level can become a support level. When a level is touched often without being broken, the strength of this level increases. It is advisable to practice with these levels so that you learn how these concepts work.
You can use horizontal levels and trend lines to display these types of levels on the graph. In the rest of the article, we’ll take a look at how this works.
How do you use horizontals?
Horizontal levels are powerful. A horizontal level is a level where the price has made multiple touches without breaking through. Horizontal levels are so powerful, because many people keep an eye on these levels. Professional investors monitor whether these levels are breached. When this eventually happens, many investors take a position. It is precisely because so many investors use these levels that they work. You can only use a horizontal level when there have been several touches.
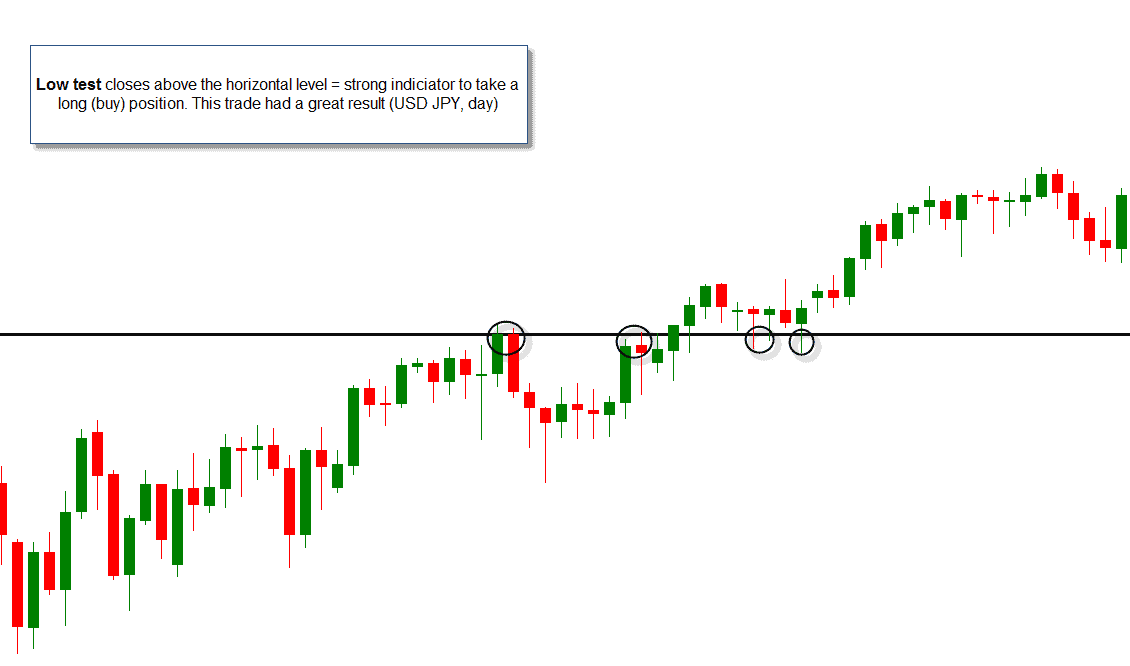
Only with a strong horizontal level in combination with the correct candlestick is it wise to open an investment position. In the example below, the USD JPY currency pair has been in an uptrend for a long time. In this situation you should look for a good moment to open a buy or long position on the currency pair.
At a horizontal level, the chance of a bounce (the price bounces off the level) is high. When this horizontal level was tested by a low test and the price closed above the level again, there was enough reason to open a trade. This ultimately yielded a good result!
 Waiting for a retest in case of a breakthrough
Horizontal levels can sometimes be very strong and a false breakthrough is therefore not unlikely. Before you take a position because of a breakthrough, it is therefore, wise to wait for the retest. A retest is a second touch of the horizontal level, after which the price does not fall back to the old level, but continues to develop.
After a break of the resistance level, the resistance level often turns into a support level. The other way around, this is also the case: if the support level breaks, there is a good chance that this level will now become a resistance level. Below you can see an example of a breakthrough and a retest on which I took a short position.
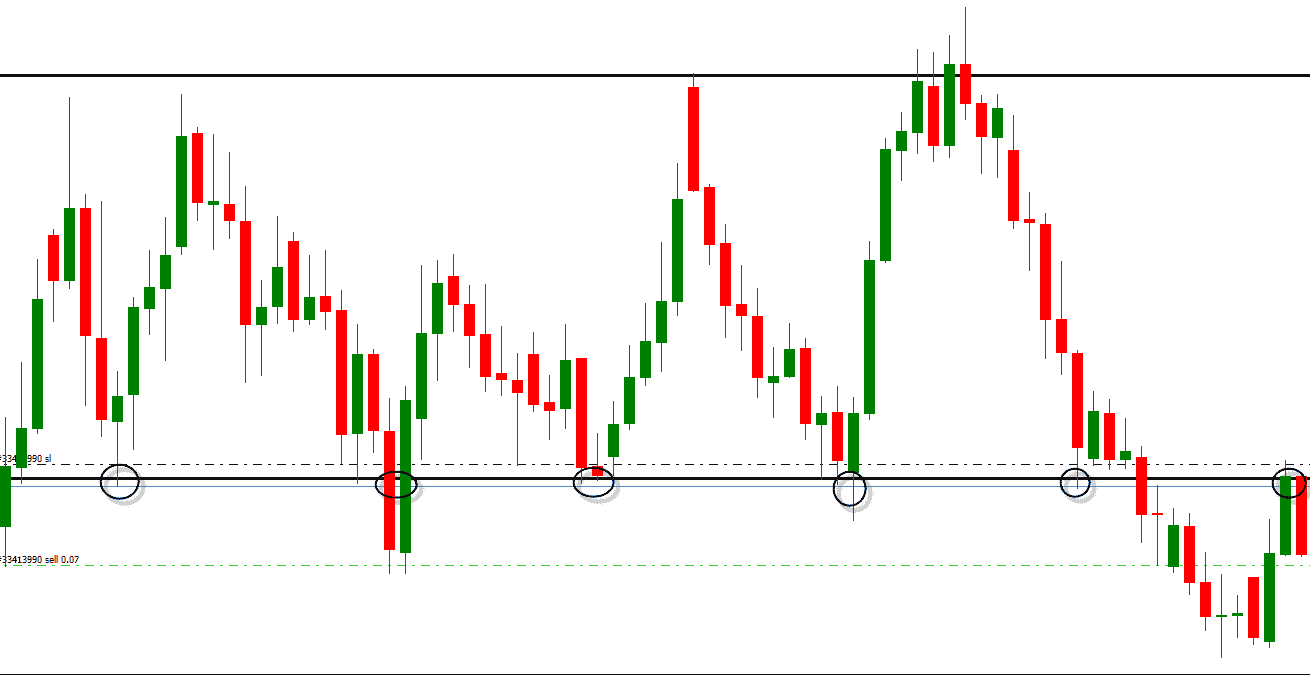 The price clearly moved in a consolidation initially. The price broke the strong support level and has now tested this level with a train tracks candlestick pattern. The price closed below the level, so a short position seems like a good idea!
How do you trade with support & resistance?
You now know you can use horizontal levels and trend lines to indicate the areas of support and resistance in price developments. But how do you achieve the best investment result with stocks and Forex by using these levels?
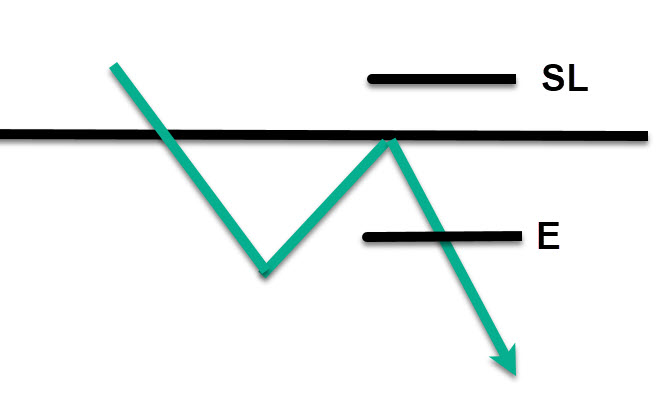
Trading the bounce
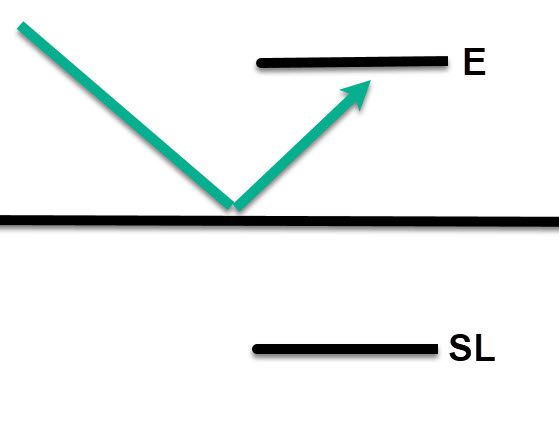
The best way to take a bounce position, is to place the order after you are sure the bounce is about to occur. Therefore, do not place the order blindly on the resistance or support line.
It is wiser to wait for the price to hit the support or resistance level. You can then place an entry order a bit away from this level in the direction of the trend (E). Only when the price bounces off the level, you will open a trade by triggering the entry order. For protection, you can place a stop loss on the other side of the support or resistance level (SL). If the price moves in the other direction, your trade will automatically close protecting you from a potential loss.
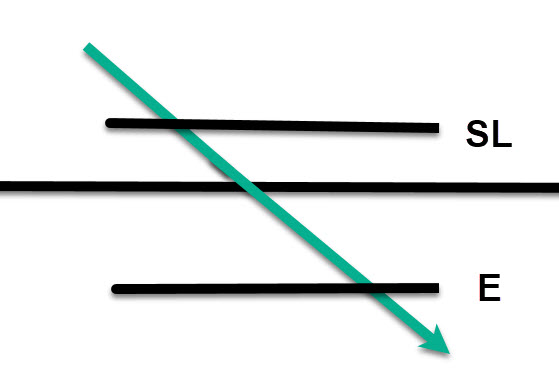
 The breakthrough
You can also achieve good results with a breakthrough. If you are a more aggressive speculator, you can place an entry order (E) directly below the level. You then place the stop loss on the other side of the level (SL).
 The more conservative and safer trader only takes a position on a so-called pullback. A support level or resistance level is often tested before it is definitively broken. By applying a more conservative trading strategy, you may miss out on some profitable investments. At the same time, you also reduce the chance of losing money on your trade.
 It is important to remember that Forex pairs and stocks do not always move according to these predictable patterns. Therefore, it is smart to always use a stop loss! By doing so you avoid losing a good deal of your deposit because you trade on nothing but futile hope.
Trend lines: additional confirmation
You can use trend lines to determine the general direction of the price. By drawing a trend line, you can determine whether it is wise to buy or sell the currency pair. Trend lines can also be used to identify a potential bounce, which is an attractive moment to open a trading position.
Trend lines in combination with other technical indicators can provide a strong basis for taking trades. Keep in mind that trend lines mainly indicate general movement, and that it is important to use other indicators as well when you open an investment. Trend lines are not strong on their own, so use them in combination with a horizontal level!
How do you draw trendlines?
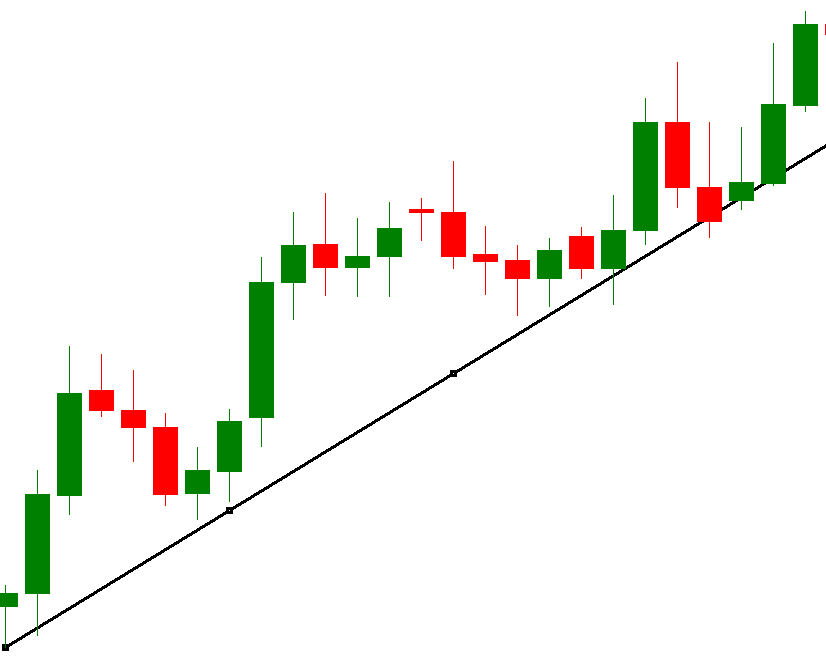
It is straightforward to draw a trend line within MetaTrader. To do this, press the oblique line in the toolbar and place it with your mouse on the line where a trend line can be recognized. The trend line must connect the lowest points in an uptrend and the highest points in a downtrend. A minimum of three touches is required to be able to speak of a strong trend.
 In a consolidation there is no clear trend. You cannot use trendlines in this case. A trend line is only useful when an up or downtrend can be identified. Within MetaTrader you can also draw horizontal levels: press the straight line at the top of the toolbar. You can use horizontal levels within a consolidation.
Auteur

Over Alex Mostert
When I was 16, I secretly bought my first stock. Since that ‘proud moment’ I have been managing trading.info for over 10 years. It is my goal to educate people about financial freedom. After my studies business administration and psychology, I decided to put all my time in developing this website. Since I love to travel, I work from all over the world. Click here to read more about trading.info! Don’t hesitate to leave a comment under this article.