
What is technical analysis?
As an investor or trader you can use technical analysis to predict price movements. Technical analysis is particularly useful for short-term investments. In this course you will learn everything you need to know to predict the share prices yourself by means of technical analysis.
What is technical analysis?
In technical analysis, you study graphs and try to recognize patterns in them. You use data from the past and on that basis you try to make a prediction about the future. With technical indicators, you can find good moments to buy and sell your shares.
Technical analysis differs greatly from fundamental analysis. In fundamental analysis, you try to make a prediction about the future by using the current financial figures of the company. Fundamental analysis is more useful for long-term investments, while technical analysis can be used for short-term speculation. Here you can read more about fundamental analysis.
How does technical analysis work?
The first time people see technical indicators, they often believe technical analysis is some sort of math. Luckily, technical analysis is not that complicated. Technical analysis is by no means an exact science and can only be used for timing your trades. When you apply your analysis, you should always look for a certain combination of factors.
When multiple technical indicators come together the predictive power increases. If this is the case, it is more likely that the share price will move in the predicted direction. When you use technical analysis you try to determine the moment at which you have the best chance of making a successful investment or trade.
Technical analysis course
Do you want to learn how to apply technical analysis? In this short course you can learn how to apply the most important techniques yourself.
Recognizing a trend
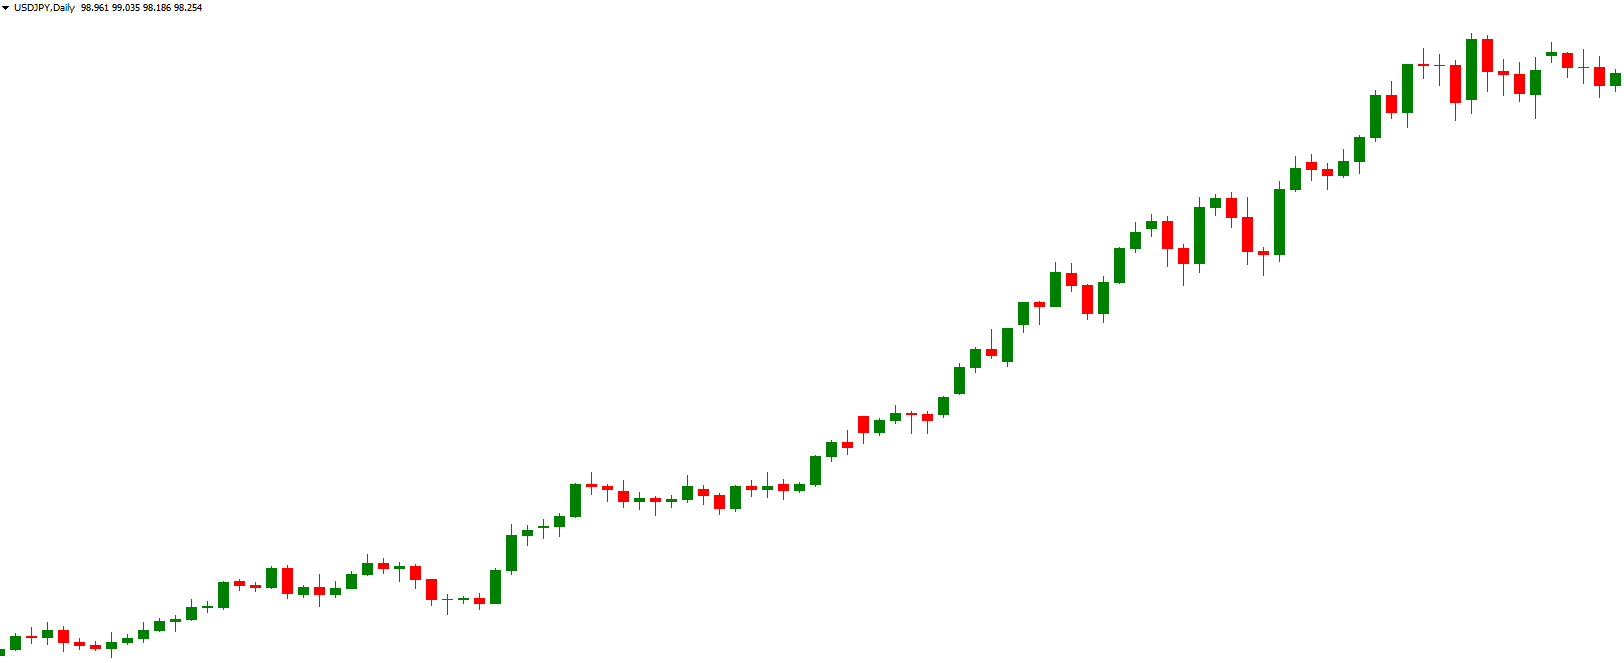
When applying technical analysis, it is advisable to first investigate the current trend. There are three main trends you can recognize:
Uptrend: the price mainly rises.
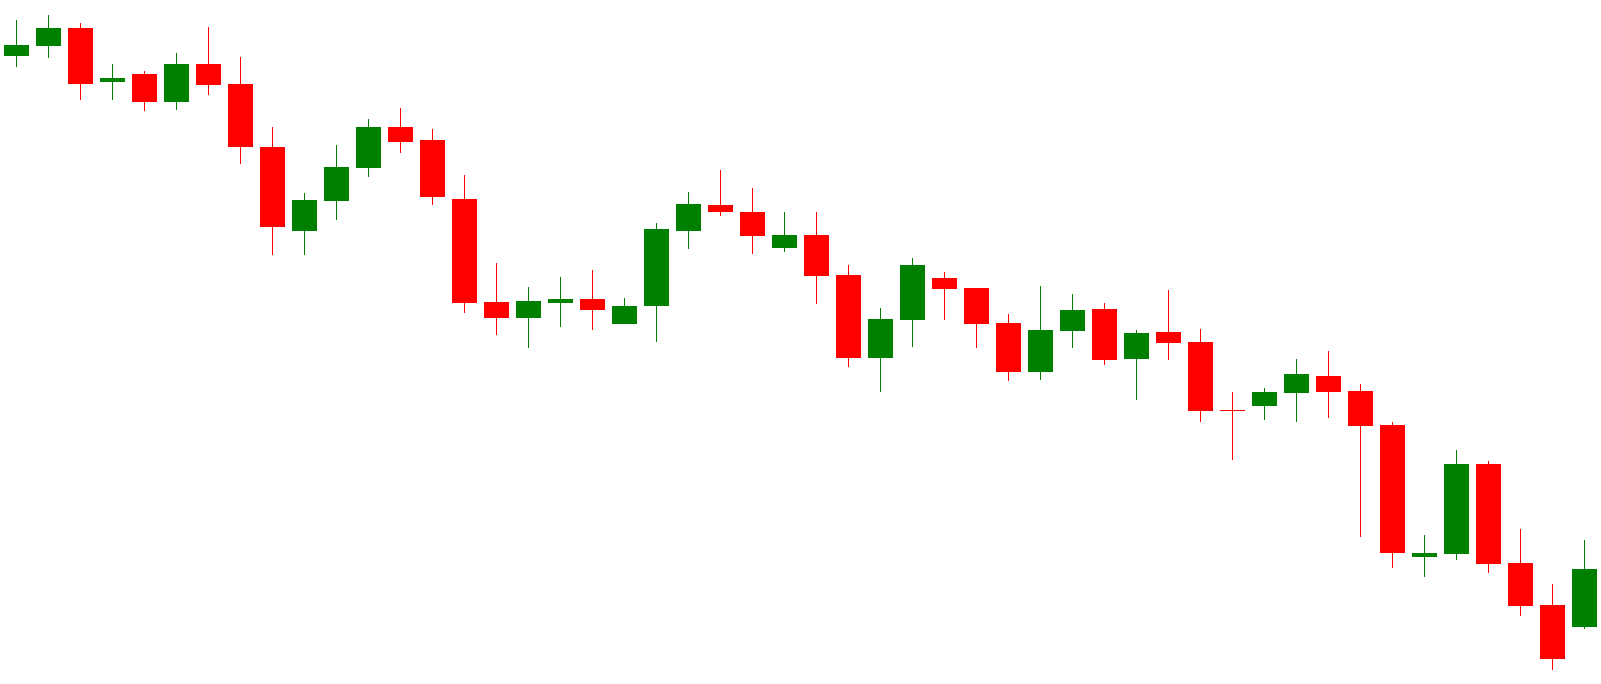
Downtrend: the price mainly decreases.
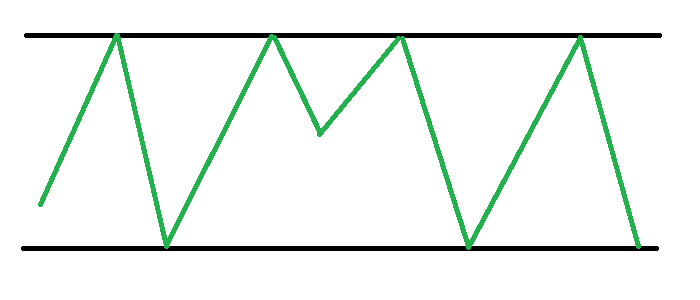
Consolidation: the price mainly moves sideways.
When you start trading, it is best to trade in tune with the trend. Some people choose to trade against the trend. When you trade against the trend, timing is even more important.
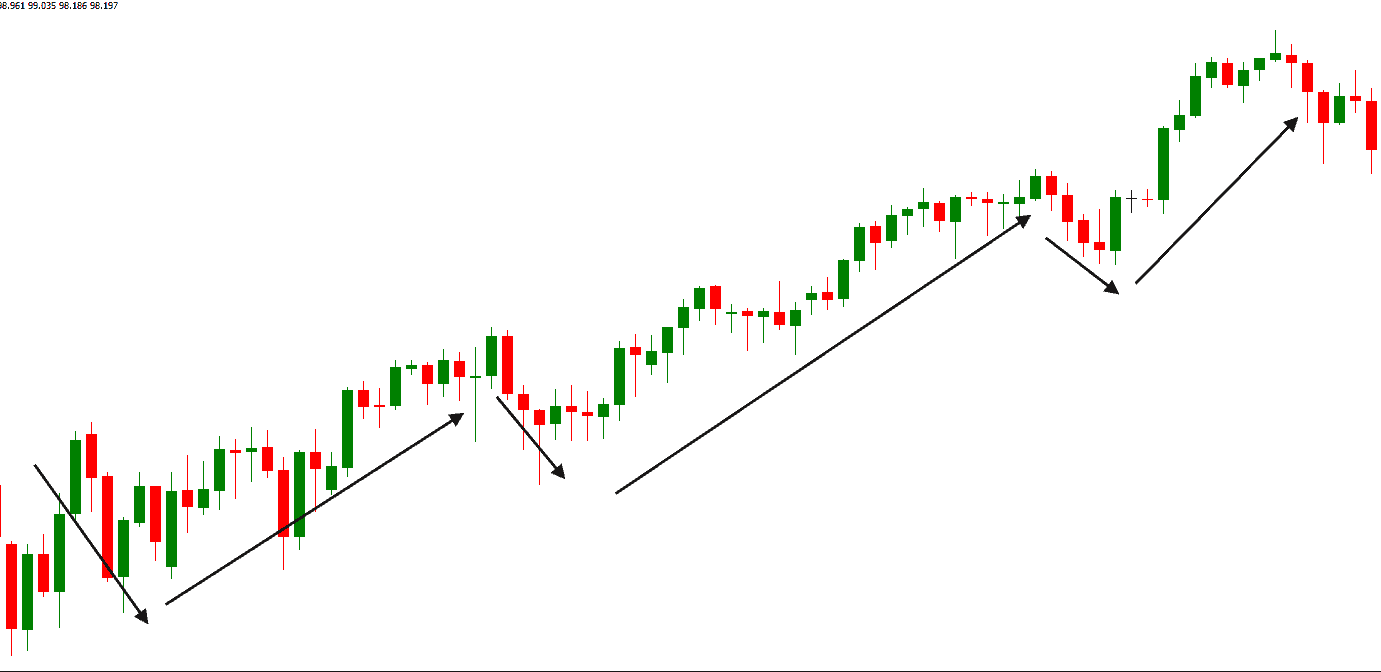
When you trade in tune with the trend, it is best to take a position when the price makes a small movement in the opposite direction. For example, with an uptrend, you often see that the price first rises (the impulse) to be followed by a decrease (the retracement).
Do you want to learn more about recognizing a trend? Our article on this topic explains how you can recognize a trend:
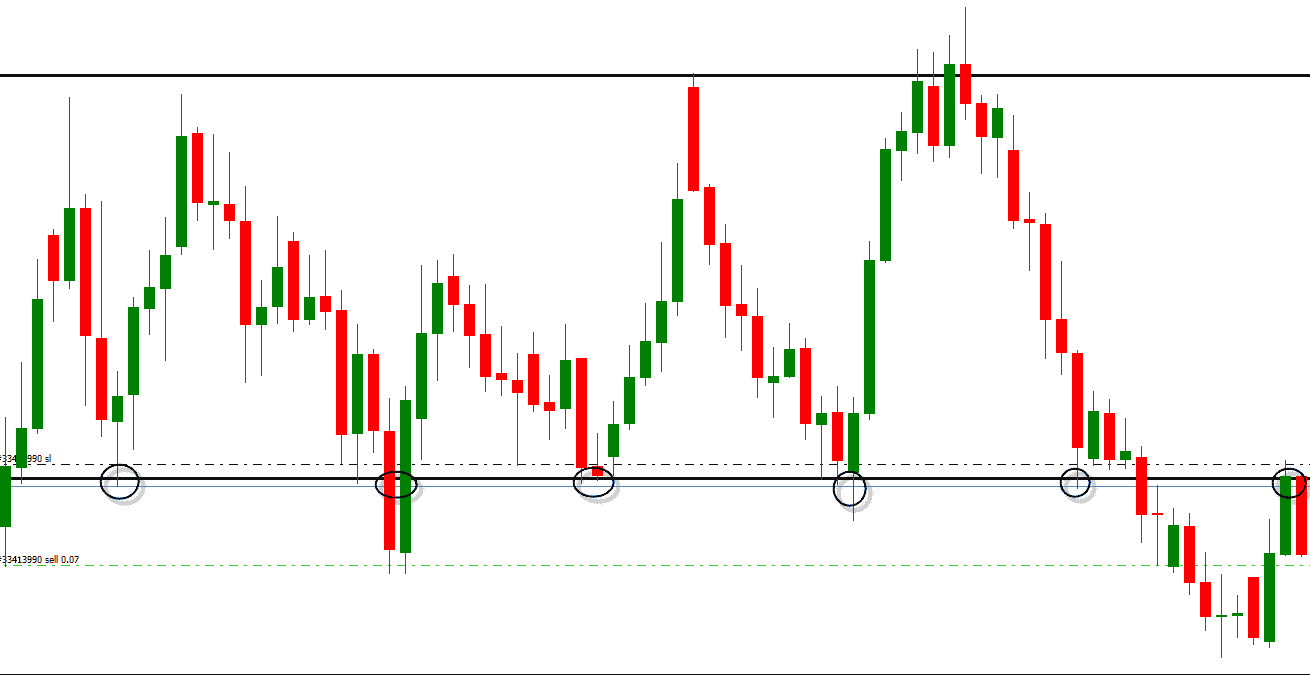
Recognizing horizontal levels
The second step in your analysis is to search for a strong horizontal level. Horizontal levels are price levels which the price would have difficulty surpassing. There are two types of levels:
- Support level: a level which the price does not fall under (bottom).
- Resistance level: a level which the price does not surpass (ceiling)
At these levels, it can often be interesting to open a trade. The probability of a movement in the opposite direction is greatest at a horizontal level. Do you want to learn more about horizontal levels? In our article on this topic you will learn all about the use of horizontal levels:
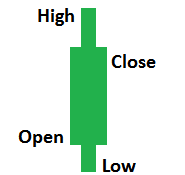
Using candlesticks
When applying technical analysis, it is wise to use candlesticks. A regular line chart gives you little information about price trends within a certain period. With a candlestick, you can make better investment decisions.
A candlestick always consists of a body and a stick. The stick indicates the price range within the day and the body indicates at what price the share opened and closed on that day. Candlesticks give away a lot of information and can help you make a trading decision. Do you want to learn more about candlesticks? Read our article about candlesticks:
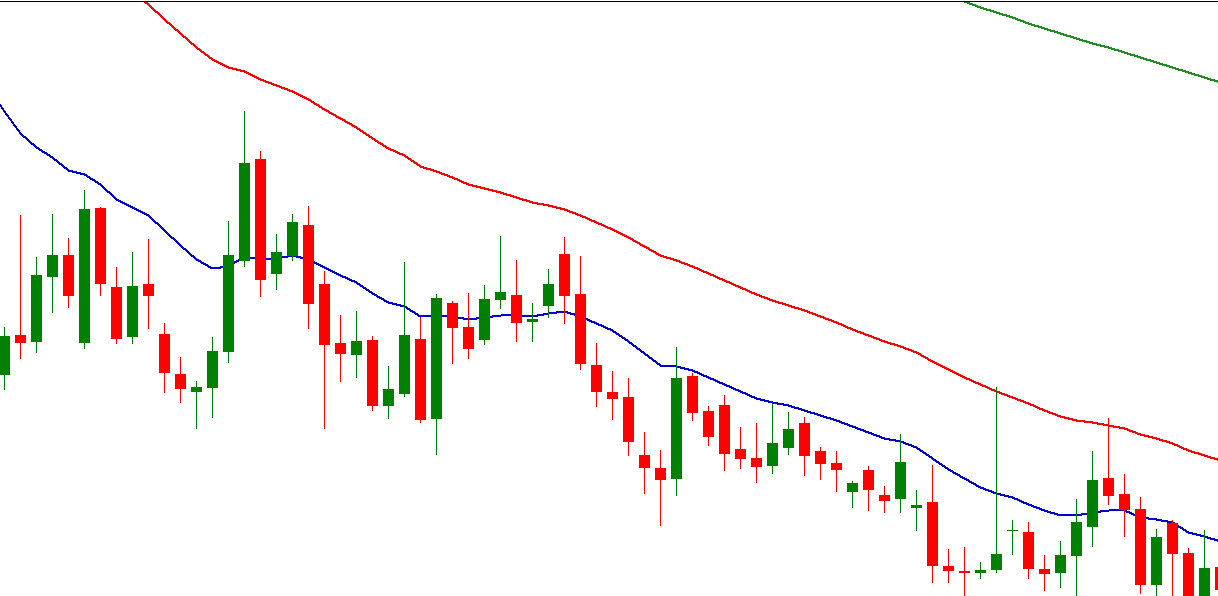
Moving averages
You can use technical indicators to decide whether it is wise to buy or sell a share. A moving average shows how the average price of a stock has developed over a certain period. It is advisable to use the 50 and the 200 moving average. You can use the moving averages to determine if it is wise to invest at that time.
The moving average also provides a lot of information about the current trend. When the moving average has a sharp angle, the trend is getting stronger. When the distance between the two moving averages increases, this is also an indication that the trend is getting stronger. Do you want to know more about using the moving average? In this article you can read everything you need to know about moving averages:
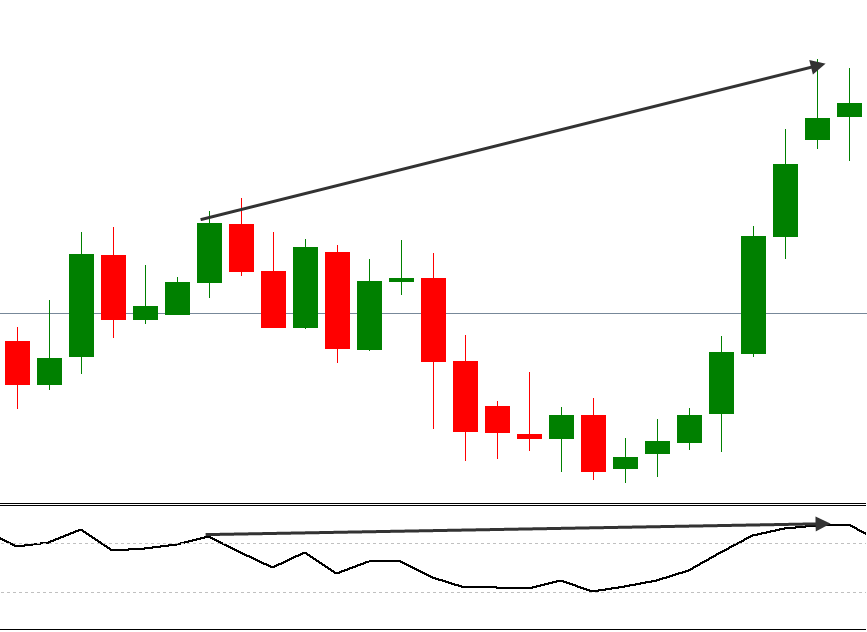
RSI or Relative Strength Index
The relative strength index is another useful technical indicator you can use when you start trading. With the RSI, you can determine if there is a good opportunity to enter the market. The indicator shows whether a share has been overbought or oversold during a certain period.
In addition, you can use the RSI to determine if there is a good chance that the price will move even further in the same direction. If the RSI moves in the same direction as the share price, the trend will probably continue. However, if the RSI moves in the opposite direction, chances are that the trend will reverse. Do you want to know how you can use the RSI on your trading activities? In our tutorial about this subject you will learn everything you need to know about the RSI:
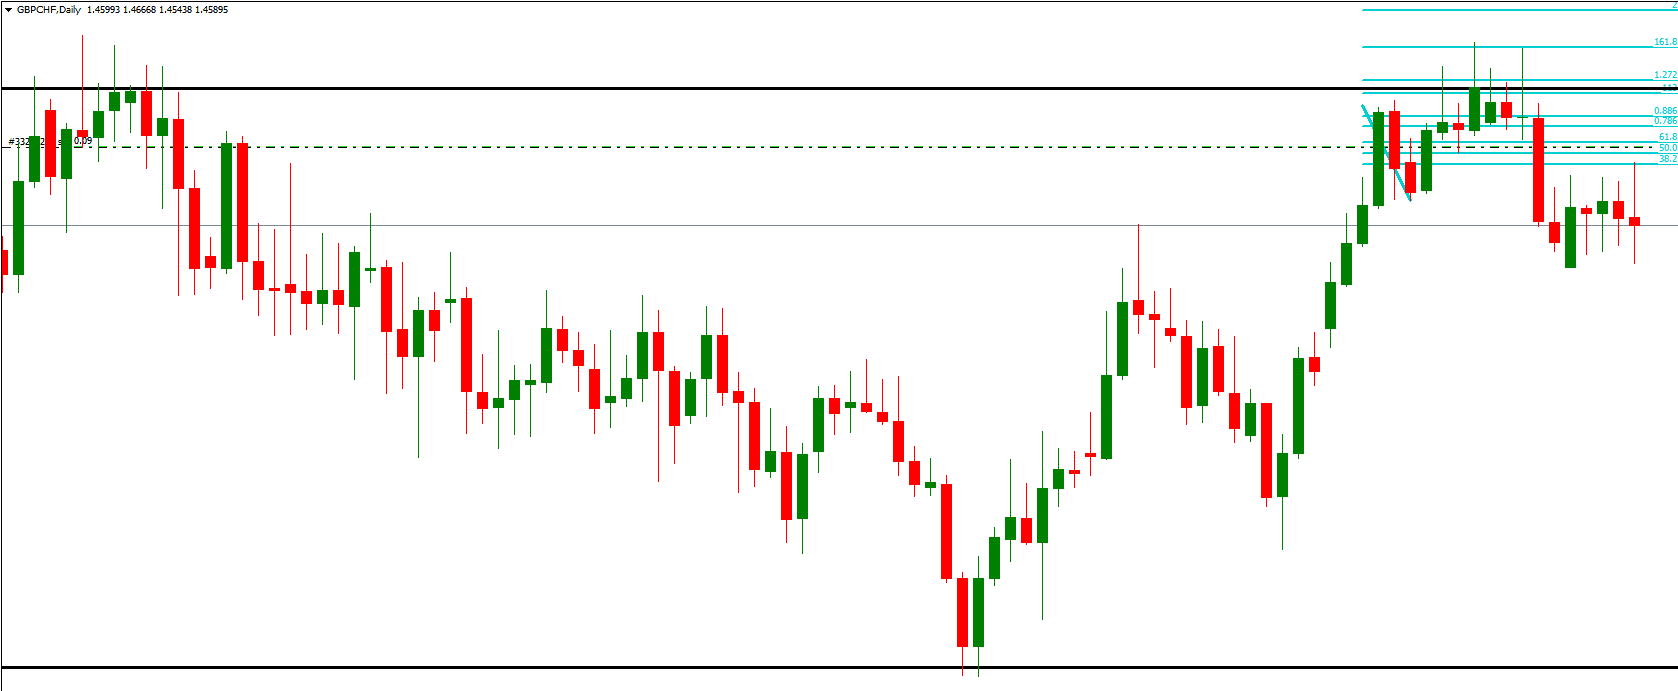
Fibonacci as indicator
The final technical indicator we will discuss in this article is the Fibonacci indicator. The Fibonacci sequence of numbers is an almost magical sequence that you will find anywhere in nature. Funny enough you can also find the same number sequences on the financial markets.
The Fibonacci numbers can be used to predict when a share price will continue to rise or fall. Do you want to know how you can apply the Fibonacci numbers to your trading activities? In this article you can find all the information you need:
What is technical analysis based on?
In technical analysis, it is assumed that all publicly available information is already incorporated into the price. Therefore, the focus of this type of analysis is on the statistical analysis of price movements. According to Charles Dow, the founder of technical analysis, the market is moving according to predictable and identifiable patterns.
Technical analysis is based on the belief that history repeats itself. This is frequently seen in practice: the price of share often moves within a fixed range. When the lowest or highest level is reached you see that the price often moves in the other direction. However, it is important to remember that technical analysis is not a holy grail: it remains a subjective prediction that does not always come true. Hence, it is important to apply technical analysis in the right way.
How can you best apply technical analysis?
When you want to trade successfully by using technical analysis, it is important to set up a good system. To set up a good system, you must first make the necessary decisions.
Which broker will you choose?
It is important to choose a broker that suits you. Not all brokers are equally suited to execute technical analysis. When you want to apply technical analysis, you need to choose a broker that allows you to use indicators on a graph. It is also important to choose a party with low transaction costs. By doing so, you get the highest return possible with your trading activities.
Would you like to know at which brokers you can trade by using technical analysis? By pressing the button below you can directly see our overview of the best brokers to trade with:
What do you want to invest in?
Subsequently, it is important to determine what you want to invest in. Do not go wild by trading random stocks. At first, it is wise to limit yourself to a couple of stocks that you monitor closely.
Set your rules
It is important to set clear rules. Determine which technical indicators you will use to set your strategy. In any event, you should always consider at what price you want to open a trade. Besides this, it is also wise to determine the levels at which you will take your profit or loss.
It is also important to determine how you will deal with your risks. Good trades ensure that the potential profit on an investment is always higher than the potential loss. In the article becoming a day trader you can read more about managing your risks.
Testing
Next, it is important to test your analysis as much as possible. You can do this by applying your strategy to old data. However, it is important to remember that past results do not guarantee positive results in the future.
It is therefore advisable to try your strategy with a demo. By using a demo you can simulate the investment results based on real data. Do you want to know where you can open a free demo? By pressing the button below you can directly open a free demo account:
What are the limitations of technical analysis?
In practice, history does not always repeat itself. However, technical analysis is based on this is the principle. It is therefore advisable to use a stop loss. With a stop loss, you avoid losing a large amount on your entire investment.
Technical analysis also often becomes a ‘self-fulfilling prophesy’. For example, many investors place a stop order below a strong horizontal level. When enough people do this it can actually affect the share price. After all, it is the game of supply and demand that determines the price of a share.
Combining analyses
Both technical and fundamental analysis have their limitations. Professional investors often choose to combine both techniques. By getting information from multiple sources, you often deliver the best trading results.
Auteur

Over Alex Mostert
When I was 16, I secretly bought my first stock. Since that ‘proud moment’ I have been managing trading.info for over 10 years. It is my goal to educate people about financial freedom. After my studies business administration and psychology, I decided to put all my time in developing this website. Since I love to travel, I work from all over the world. Click here to read more about trading.info! Don’t hesitate to leave a comment under this article.