
Using moving averages when investing: explanation
Moving averages are very useful as a technical indicator when trading Forex and shares. You can use them to determine strong support and resistance levels. Moving averages are calculated by averaging the price over an X number of periods.
Tip: Read more about support & resistance in the article about trend lines & horizontals!What are moving averages?
A moving average is a technical indicator that you can use when trading shares. With the moving average, you can see how the average price of a share has developed over a period of time. This eliminates small, random price fluctuations.
Understanding Moving Averages
The moving average is a trend following or lagging indicator, as the indicator is based on past prices. The delay is greater for longer periods: the 200-moving average is thus further behind than the 50-moving average. You can adjust the moving average yourself: if you take a shorter period of time, the indicator is a lot more sensitive. The short-term moving averages are especially useful for short-term trading, while the long-term moving averages are useful for the long-term investor.
The 50 and 200 moving averages are popular among investors: however, this does not mean that other moving averages cannot be used. You can experiment with different levels to see what works best for you.
How do you set moving averages?
When investing, you can choose between two types of moving averages: the simple moving averages or SMA and the exponential moving averages or the EMA. The simple moving averages are calculated by adding all the closing prices of the periods and dividing them by the number of periods. The EMA also calculates the average. The only difference is that the closing prices of the later periods count more strongly here.
The strength of any technical indicator lies in the number of investors who use it. Investors mainly use the 50 and the 200 days moving averages. There is no strong difference between the use of the simple or exponential form. So, when you are going to invest in Forex or shares, it is wise to use these specific moving averages.
We only use moving averages if there is a clear trend. Within a consolidation, a moving average is therefore unusable. Only when I consider opening an investment, do I place the moving averages back on the chart to see if they match the trade I want to open.
I do not, therefore, use moving averages as a decisive factor. You can see moving averages as an extra factor that can give you confirmation of your plan.
Set the moving averages within Plus500
A handy broker where you can use moving averages is Plus500. Would you also like to open a free (demo) account with this broker? Then click here for more information!
Setting the moving averages within the Plus500 software is easy. To achieve this, press the setup indicators button and select the moving average indicator. Here you can enter the periods one by one (50,200). Don’t forget to tick exponentially when you want to use this. Select colours that are easily distinguishable from each other (e.g. blue and red).

Setting moving averages within MetaTrader
Also, within MetaTrader it is straightforward to add moving averages. To do so, go to Insert, Indicators and select moving averages. Add the indicators one by one with the values 50 and 200 and exponential as type. I always make the moving average a bit thicker and give them striking colours so that the moving averages are easy to recognize and analyse.
The position of the moving averages
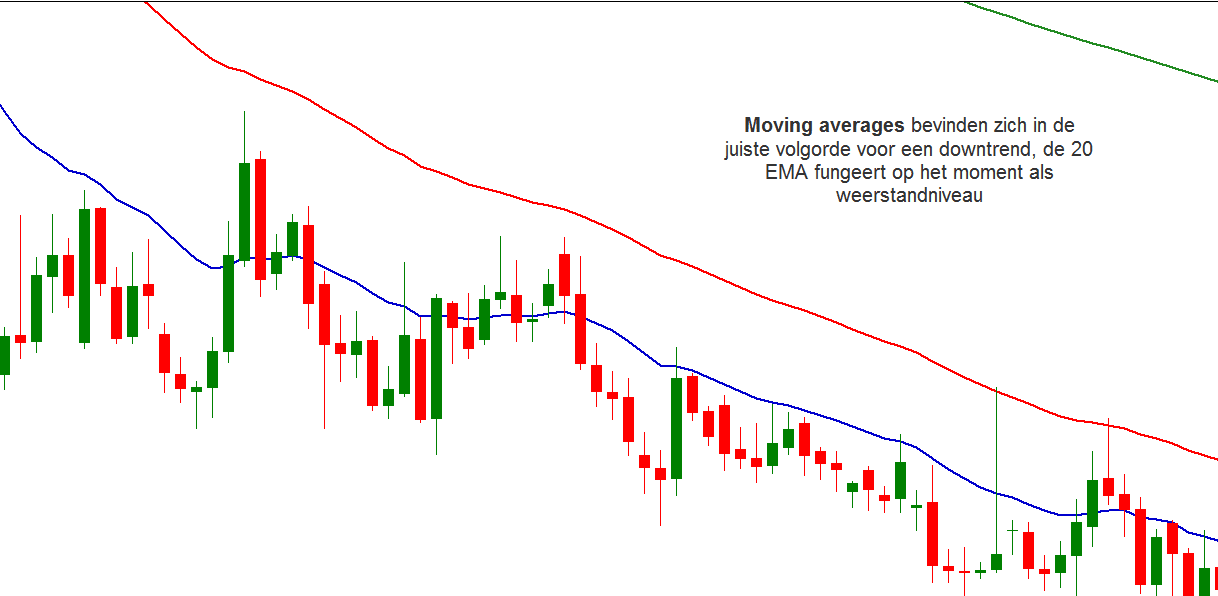
The position of the moving average can be used to determine the general trend. In case of a downtrend, the moving averages are normally above the current price, it is then wise to sell. When the moving averages are just below the price, there is an uptrend and it is wise to buy.
It is important to look at both the 50-moving average and the 200-moving average. Both averages must be below the price to identify a long set up (where you buy). When you look at a short set up (where you sell) both indicators must be above the price. In addition, the indicators must be in the correct order: 50 and then only 200!
You can also look at the movement of the moving average: when the moving average rises, there is probably an uptrend and when the moving average falls there is probably a downtrend.
A crossover can give you even more information. When a short-term moving average (50) crosses over a long-term moving average (200), this is a clear confirmation of a rising trend. When the short-term moving average (5) crosses below the long-term moving average (200), this is a clear confirmation for a falling trend.
You can use the moving average in combination with the MACD, which subtracts a 26-day exponential moving average from a 12-day exponential moving average.
How to use moving averages as support/resistance?
Moving averages can also be used as support or resistance levels. See if one of the moving averages is always touched without being broken through. If this is the case you can use them as extra support when taking up a new position.
When the market consolidates (the price has no clear direction) the moving averages are often quite flat. When the price has no clear direction, the moving averages are therefore not useful: in this case you should remove them from the chart.
What should you pay attention to in the case of moving averages?
- The order is important: are the moving averages sorted in order? The order is normally 50 and then 200 where the fastest indicator is closest to the current price level.
- The angle of the moving averages can be used to determine the strength of the trend. A sharper angle is often an indication that the trend is getting stronger.
- Finally, the separation between the moving damages is important. When the distance between the moving averages increases, the trend intensifies.
How do you use moving averages?
Moving averages can therefore be perfectly used to support the identification of resistance and support levels. I always use moving averages as an indicator as soon as I want to take a position to see if there is an additional confirmation. Most of the time, however, I simply remove the moving averages from the chart: in the end, the price action and horizontal levels are decisive for taking a position on the Forex or stock market.
Auteur

Over Alex Mostert
When I was 16, I secretly bought my first stock. Since that ‘proud moment’ I have been managing trading.info for over 10 years. It is my goal to educate people about financial freedom. After my studies business administration and psychology, I decided to put all my time in developing this website. Since I love to travel, I work from all over the world. Click here to read more about trading.info! Don’t hesitate to leave a comment under this article.