
MACD explanation – Moving average convergence/divergence
The MACD (full Moving Average Convergence Indicator) is easy to use in markets with a clear trend and is calculated by combining moving averages. The MACD can confirm or cancel out the strength of a trend.
What is the MACD?
The MACD indicator is a so-called momentum indicator. The MACD combines several moving averages. Eventually two lines come out of this. You can then use the MACD to determine the direction of the trend and its strength. You can also use the MACD to find a good entry point for your investment. But how does the MACD work exactly?
How does the MACD work?
The MACD is based on the 12 and 26- day average. A new line is drawn from these averages by subtracting the 26-day average from the 12-day average.
The value of the MACD is positive when the 12-day average is above 26 days and negative when the 12-day average is below 26 days. When the line is above zero, there is a buy signal, and when the line is below zero, there is a sell signal.
A second line within the MACD is the so-called signal line. This is comparable to the exponential RSI. The second line measures the exponential average of the last nine days.
How can you set the MACD?
Within Plus500
Plus500 is a good broker to use the MACD indicator. You can try investing in CFDs for free at this broker with a demo. Click here to get started or read more information about this broker first.
From the toolbar, go to the setup indicators button and choose the MACD/OsMA indicator with values 12,26 and 9. You can disable the signal line by turning it white.

Within the MetaTrader
Go via insert, indicators to oscillators and select the MACD option. Use the settings 12, 26 and 9, you can change the colour of the line from red to black to make it stand out more. We don’t use the histogram with the MACD, it’s the most important one, and you can give it a white colour, so it doesn’t stand out.
MACD and the trend
The direction of the MACD indicates the trend. When the MACD line rises, there is a rising trend and when the MACD line falls, there is a falling trend.
You can also use the MACD to determine the strength of the trend. You do this by looking at the distance between the MACD and the signal line. With a larger distance between both lines, there is a stronger trend.
The MACD is a good indicator to gain more insight into the trend. However, you cannot use the MACD to predict the bottom or ceiling of the price of a share. It is therefore wise to use the MACD in combination with candlesticks and horizontal levels.
The MACD as a signal
You can also use the MACD (in combination with other indicators) as a buy or sell signal. To do this, you must pay attention to crossing the MACD and the signal line. When the MACD crosses the signal line upwards, this can be seen as a buying signal. When the MACD crosses the signal line downwards it can be seen as a selling signal.
Finally, you can also use the MACD as an indication of a trend reversal. How does it work?
Convergence and divergence of the MACD
Convergence
When there is convergence between the MACD and the price, it is safe to follow the trend. In the event of an uptrend, the MACD should therefore increase along with the further rise in the price. In case of a downtrend the MACD should follow the further decline of the price.
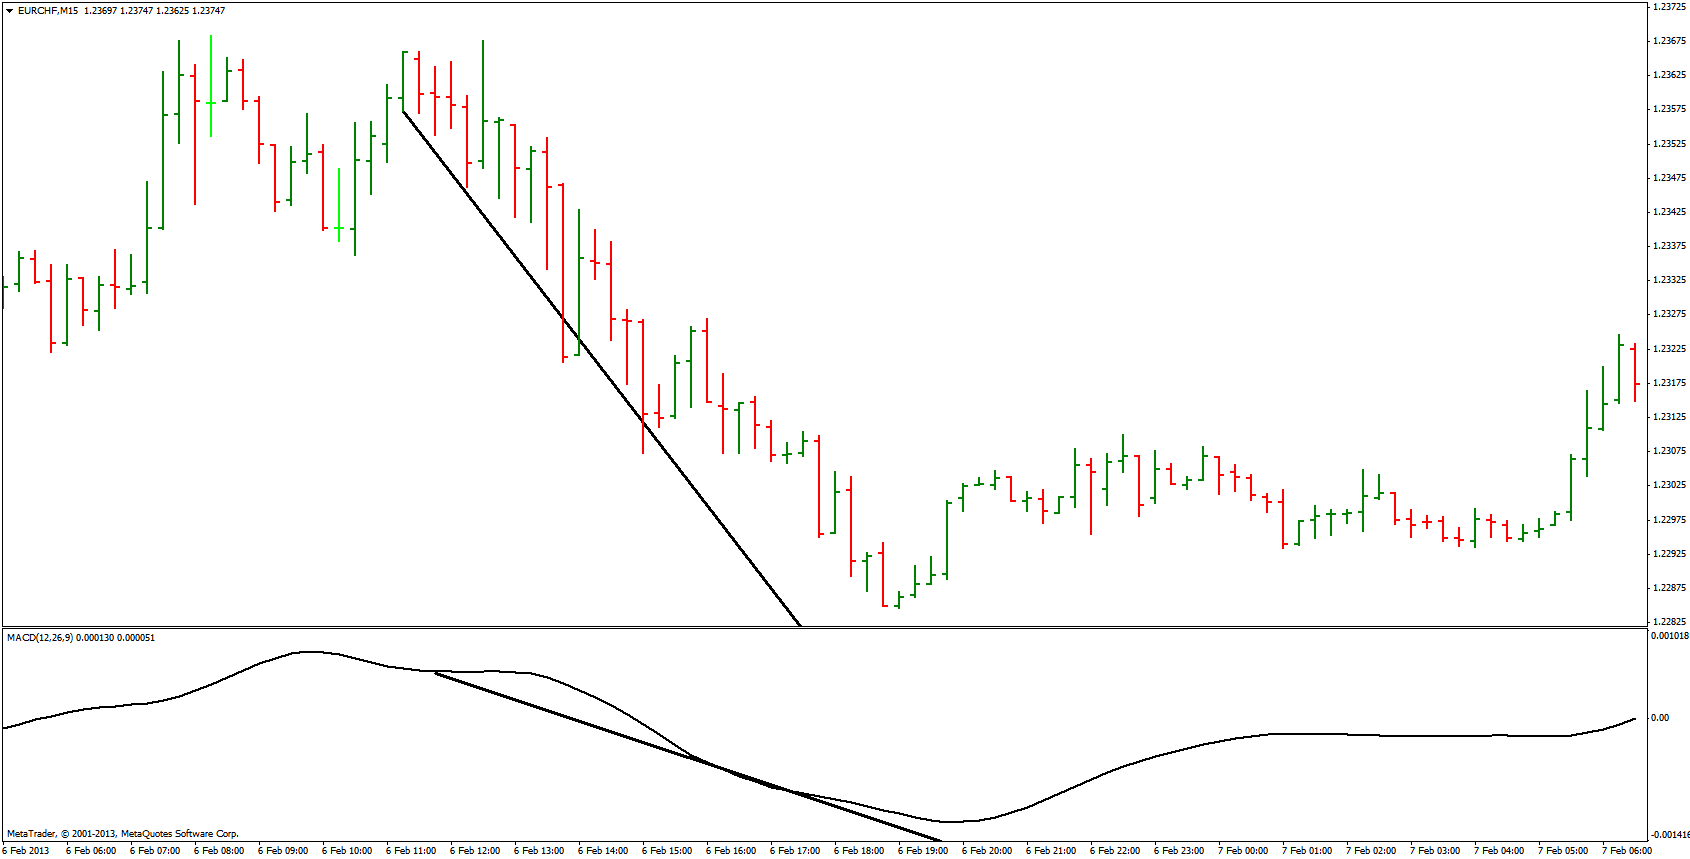
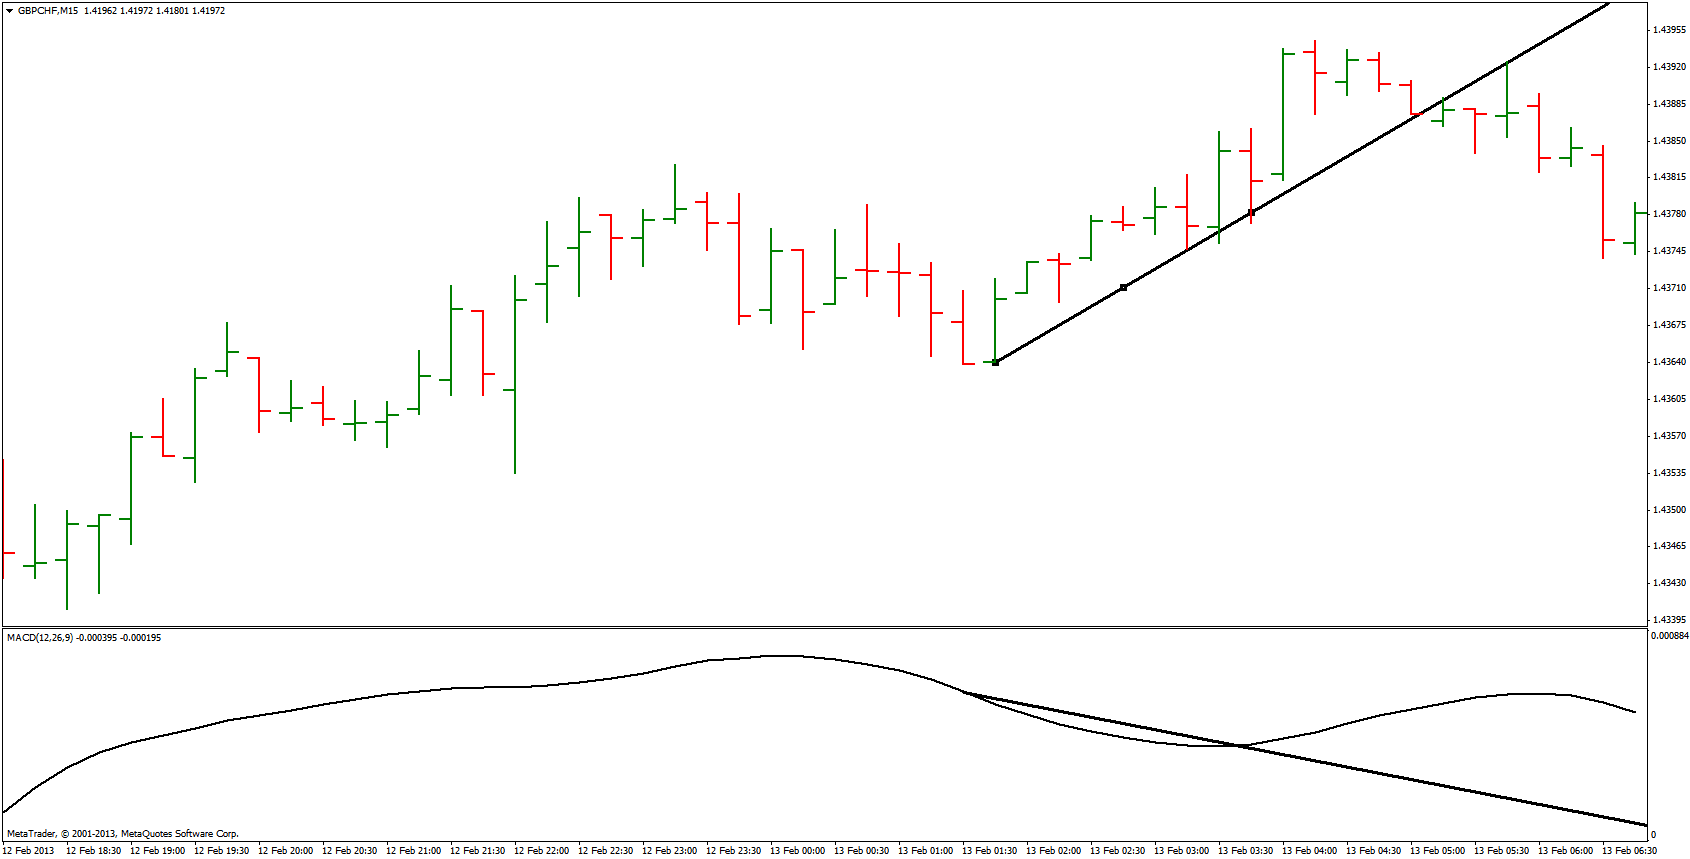
Divergence
In case of divergence, the MACD does something unexpected and moves in the opposite direction of the price. During an uptrend the MACD moves downwards and in a downtrend the MACD moves upwards. In this case, there is a fairly large chance that a reversal will occur!
MACD and the RSI
The MACD and the RSI both indicate whether a market is overbought or under bought in relation to the latest price levels. However, both indicators do this differently, which can sometimes lead to opposing conclusions. It is therefore important to always use the full picture and not to open investments just because of the performance of the MACD indicator.
What are the limitations of the MACD?
The MACD is anything but perfect: the indicator regularly indicates that the chance of a trend reversal is high without anything actually happening. Also, divergence does not predict all reversals. As a result, the MACD is not completely reliable for predicting trend reversals.
Safe use of the MACD
Use the MACD in combination with other indicators. The MACD is a confirmation of the current trend rather than being used on its own to take a position. In the end candlesticks, moving averages and trend lines are more important!
Auteur

Over Alex Mostert
When I was 16, I secretly bought my first stock. Since that ‘proud moment’ I have been managing trading.info for over 10 years. It is my goal to educate people about financial freedom. After my studies business administration and psychology, I decided to put all my time in developing this website. Since I love to travel, I work from all over the world. Click here to read more about trading.info! Don’t hesitate to leave a comment under this article.