
Using Fibonacci at Forex & Shares
The Fibonacci sequence of numbers was discovered by Leonardo de Fibonacci. The number sequence has the necessary peculiarities and can be found everywhere. Similarly, in the financial markets: the Fibonacci series can be used to measure retracements and extensions of markets in both upward and downward movements. Put simply: with Fibonacci values you can predict to which value the price of for example a share could move.
What is the Fibonacci range?
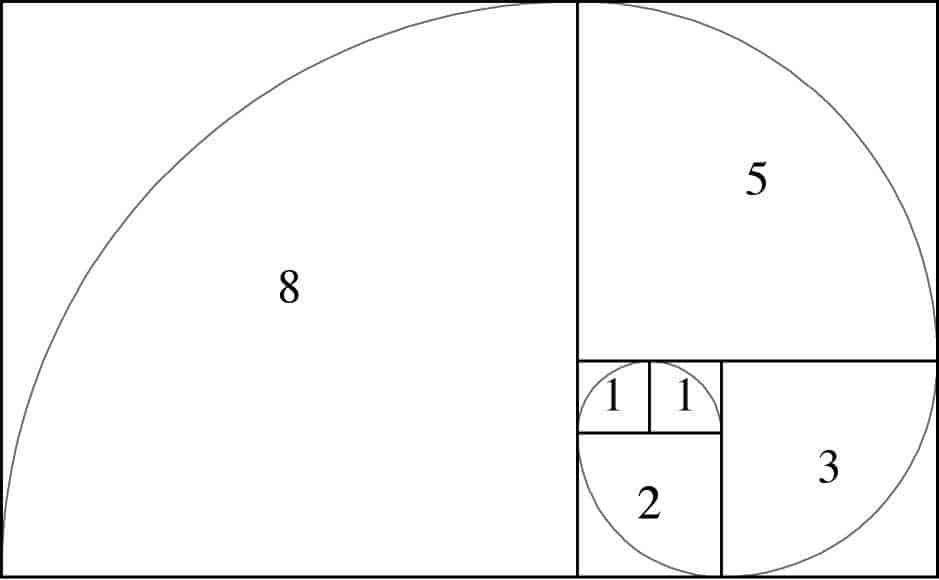
The Fibonacci series was discovered by none other than Leonardo Fibonacci. This famous Italian mathematician discovered that the whole universe could be described by a series of numbers. These natural proportions appeared to recur everywhere! In plants, animals and also humans.
The sequence starts with 0 and 1. The next number is a sum of the two numbers before that. So, the Fibonacci sequence starts as 0, 1,1,2, 3, 5, 8 and so on. Now many investors also believe that this natural series of numbers can be used to predict the share price. The great thing is that when enough people believe it, this will indeed be the case!
You can therefore use the Fibonacci indicator to perform technical analysis when investing in, for example, Forex and stocks.
What are Fibonacci’s ratios?
As an investor, this seemingly random series of numbers says very little, of course. What is special about the Fibonacci series are the so-called ratios. These ratios are created by dividing two numbers within the series. The best-known ratio is 0,618, which is created by dividing 34 by 55. Also by dividing 34 by 89 you get the known 0,382 ratio.
These ratios are found everywhere in nature. Did you know, for example, that the distance from the ground to your navel is always 61,8% of your height? These ratios can also be found abundantly in plants. Anyway, back to investing with the Fibonacci indicator!
Fibonacci applications
- Fibonacci retracements: good for predicting the end of a retracement and determining a good time to invest in line with the trend.
- Fibonacci’s extensions: with a Fibonacci extension you can predict when the impulse will come to an end and the retracement will start: very useful for determining an entry moment in a trend reversal.
Which numbers do you use
for measuring retracements?
- 0,382
- 0,5
- 0,618
- 0,786
- 0,886
And for measuring extensions?
- 1,13
- 1,272
- 1,618
- 2,000
The 50% retracement level is not a Fibonacci value. However, many technical traders use this value as well, as you will often see price action on this level.
Application of Fibonacci
The Fibonacci levels can be used as levels of support and resistance. By using Fibonacci levels, you can predict at which point there is a greater chance that the price will move in the other direction. It is wise to use the Fibonacci levels in combination with:
Determination of buy/sell moment in case of retracement
In case of a rising trend, you measure the upward wave movement until the moment of retracement. Connect the lowest point in the upward movement with the highest point. Values of 38%, 50%, 61.8%, 78.6%, 88.6% are moments when the price potentially rises again and these are sensible buying moments. (from swing low to swing high)
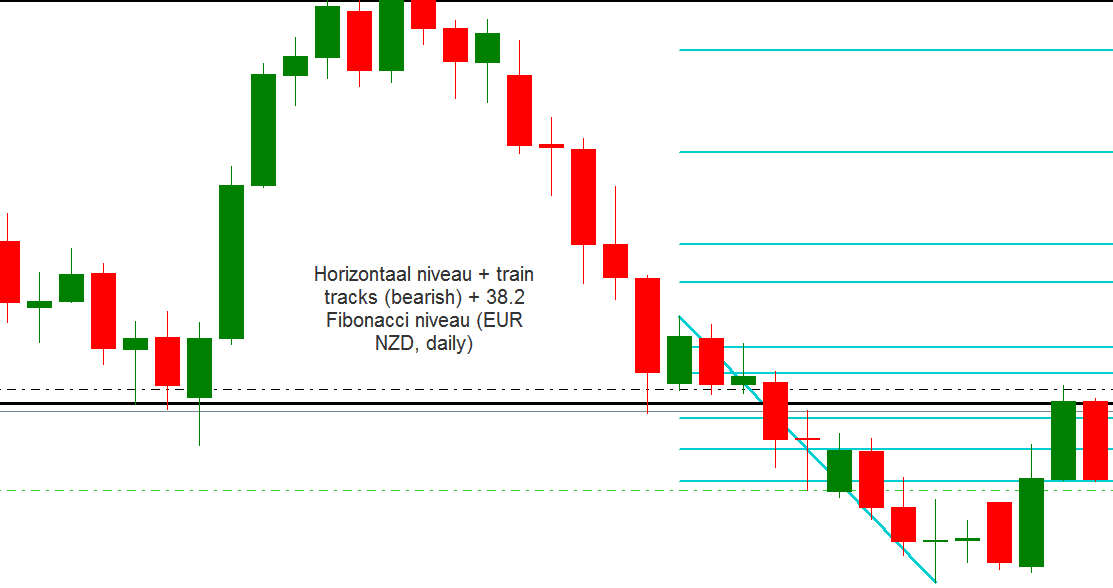
In the case of a downward trend, you measure the downward wave movement until the moment of retracement. Connect the highest point in the downward movement with the lowest point. Again the values 38%, 50%, 61.8%, 78,6 and 88.6% are drawn which are moments at which the price can continue to fall. (from swing high to swing low)
See if a Fibonacci level coincides with a horizontal level. When the price subsequently refuses this level by means of the right candlestick formation, you’ll have an extra confirmation of your trading positions.
Fibonacci with an extension
The Fibonacci range can also be used to estimate the length of the extension: either how far the price will overshoot compared to the previous high (in a rising trend) or low (in a falling trend).
The resulting values can be used to determine a new value where a retracement may occur. For a reversal, it is always wise to check whether this point coincides with a Fibonacci retracement. The values you use to find an extension are 1,13 1,272 1,618 and 2.
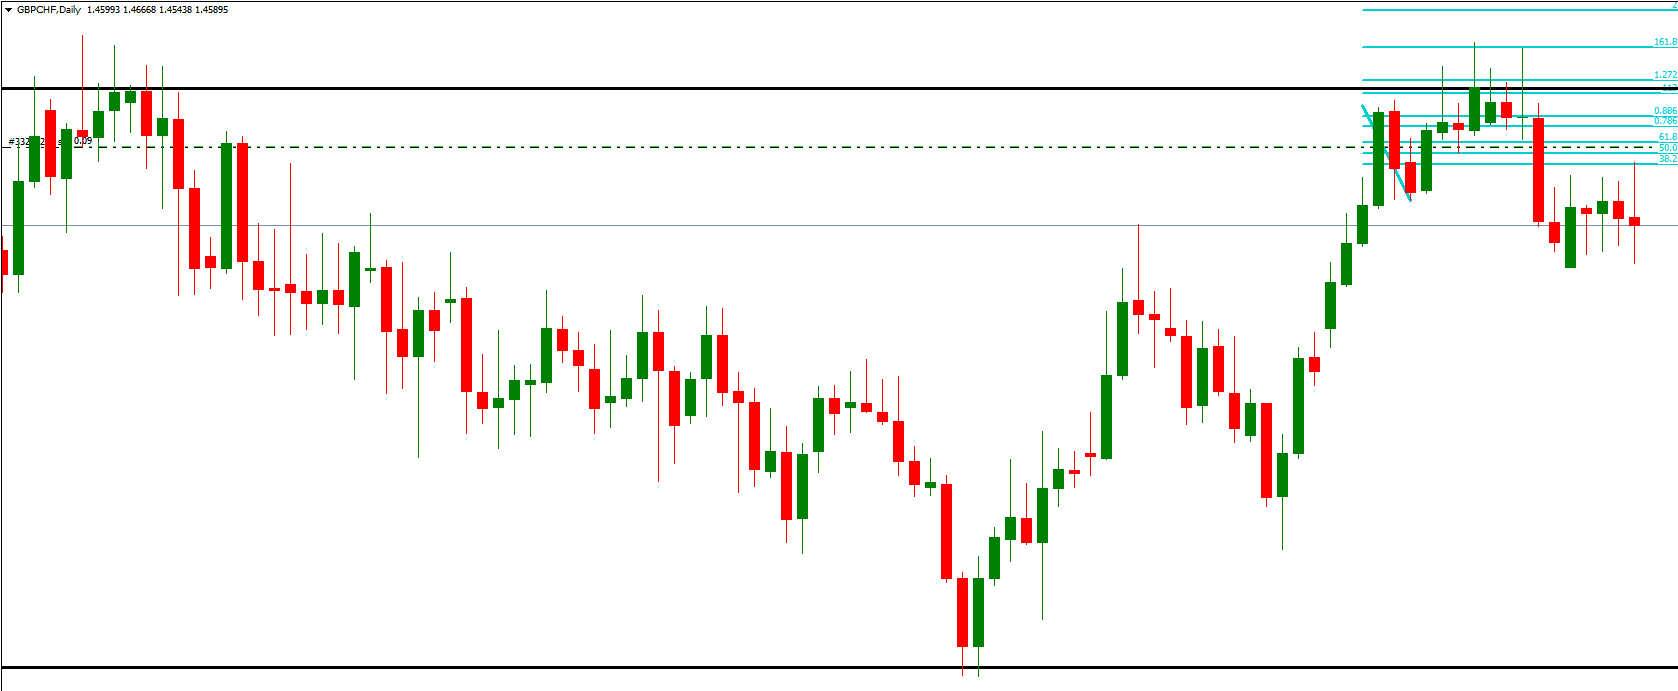
Within this consolidation, in addition to a horizontal level and a high test, there is also a Fibonacci extension… enough reason to take a short position.
Using Fibonacci with MetaTrader
Within MetaTrader you can find the Fibonacci Retracement button at the top of the toolbar, this option is used to determine the duration of a retracement. You can also use this button to draw a Fibonacci extension.

Fibonacci retracement
Before you can start using Fibonacci retracement properly, it is important to configure it properly. Draw the Fibonacci retracement somewhere on the screen and press the right mouse button on the indicator to adjust the Fibonacci properties. Enter the values 0.382, 0.5, 0.618, 0.786, 0.886 and delete the other values. Also change the colour of the Fibonacci lines to make them stand out more.
What should you watch out for with Fibonacci retracements?
The use of Fibonacci values is subjective: the traders who profit from the retracement indicate that it is an effective tool while investors who lose money indicate that it does not work. Moreover, the Fibonacci could work as a self-fulfilling prophecy: the indicator could be total nonsense, but only works because enough people use it. Therefore, there are no logical arguments for using the Fibonacci retracement. If you find it important to understand the theory behind the indicator, it is better to stay away from this indicator since there is none.
Getting started with Fibonacci
I myself had quite a bit of trouble making the indicator my own. It is therefore advisable to practise drawing the levels on the charts within MetaTrader. In this way you will develop a feeling for the indicator, and eventually, you will be able to apply it in combination with other indicators to look for setups. To be able to use Fibonacci levels properly, it is essential to properly recognize the retracements and impulses.
Auteur

Over Alex Mostert
When I was 16, I secretly bought my first stock. Since that ‘proud moment’ I have been managing trading.info for over 10 years. It is my goal to educate people about financial freedom. After my studies business administration and psychology, I decided to put all my time in developing this website. Since I love to travel, I work from all over the world. Click here to read more about trading.info! Don’t hesitate to leave a comment under this article.